In the modern enterprise, the network is the central nervous system. Every application, every transaction, every user interaction generates a torrent of data. The challenge is no longer about collecting this data but finding the critical signal within an ever-growing ocean of noise. The ElastiFlow NetObserv Flow Collector, paired with the analytical power of the Elastic Stack, provides an unparalleled platform for gaining deep network insights. ElastiFlow delivers rich, normalized network flow data, and Elasticsearch provides the engine to search, analyze, and visualize it in real time.
However, with great power comes a great data firehose. Unfiltered data ingestion leads to spiraling storage costs, sluggish query performance, and analyst burnout. Intelligent, server-side filtering isn't just an optional tweak; it's a key strategy for building a sustainable, cost-effective, and operationally capable observability platform. The question has evolved from "Can we collect it?" to "Should we collect it?", a question that directly impacts your Total Cost of Ownership (TCO) and your team's Mean Time To Resolution (MTTR).
In this guide, I provide a playbook for using Elasticsearch ingest pipelines to pre-process and filter your ElastiFlow data before it consumes valuable resources. We'll explore two practical recipes: a straightforward method for dropping shared network "chatter" and an advanced, highly efficient technique for excluding entire network segments without bogging down your cluster.
A Deep Dive into Elasticsearch Ingest Pipelines
Before we start dropping data, it's essential to understand the tool for the job. Elasticsearch ingest pipelines are a native, lightweight, and potent mechanism for performing transformations on your data the moment it arrives at the cluster, but before it is indexed. Think of an ingest pipeline as a programmable assembly line for your data. Each document passes through a series of "processors," and each processor is a station that performs a specific task: renaming a field, adding a value, parsing text, or, most importantly for our purposes, deciding to discard the document entirely. These pipelines are managed via simple REST APIs or through Kibana's UI.
The Architecture: Nodes, Processors, and Conditionals
Ingest pipelines are processed on ingest nodes within your Elasticsearch cluster. By default, any node can perform this role, executing pipelines as part of Elasticsearch's distributed architecture.
A pipeline is composed of one or more processors. While there are over 30 built-in processors for various tasks, the drop processor is interesting for this use case. It does precisely what its name implies: it stops processing the document and signals that it should not be indexed.
The critical attribute of the drop processor is its if condition. Each processor can be assigned a conditional statement, written in the Painless scripting language, that determines whether the processor should execute. This conditional logic is the brain of the operation, allowing you to create sophisticated rules. For example, "drop the document
if the destination port is 161" or "drop the document if it contains a specific tag."
Enabling an Ingest Pipeline
Elasticsearch provides two primary index settings for applying a pipeline: index.default_pipeline and index.final_pipeline. Understanding the difference is crucial to achieving the desired behavior.
index.default_pipeline: This pipeline is applied to indexing requests that do not specify a pipeline. It’s a great way to apply standard enrichments or transformations. Many Elastic Agent integrations use this model to pre-process data. It's a suggestion, a helpful default.
index.final_pipeline: This pipeline is the last word. It always runs, even if the indexing request specifies its pipeline or a default pipeline has already been applied. The client sending the data cannot override it.
This distinction is more than just a technical detail; it's a useful data governance feature. The final_pipeline is the non-negotiable enforcement mechanism. It allows you to implement cluster-wide rules for cost control, security, or compliance, such as dropping records from specific networks or removing sensitive PII, that no individual user or application can bypass. An application might use its pipeline for custom parsing, and a default pipeline might add some metadata, but the final_pipeline acts as the ultimate gatekeeper. For our filtering use cases, we will leverage final_pipeline to ensure our data reduction rules are tamper-proof and universally enforced. This mature design, which separates default behavior from mandatory enforcement, is essential for effectively managing a large, multi-tenant observability platform.
Taming the Firehose: Why You Might Want To Filter Your ElastiFlow Data
Filtering is not about indiscriminately deleting data. It's a strategic act of data curation that yields massive economic and operational dividends. By consciously defining the scope of what is "interesting" to your business, you transform your platform's value proposition. The benefits can appeal to technical leadership and the engineering team alike.
Economic Benefits:
Reduced Storage & TCO: Less data means smaller indices, which translates directly to lower disk usage, reduced backup and snapshot costs, and potentially a smaller cluster. This has a direct, measurable impact on the budget.
Lower Bandwidth Costs: In cloud environments, every byte counts. Reducing high-volume, low-value traffic can have a tangible impact on network transfer and cloud egress costs.
Operational Benefits:
Improved Query Performance: Smaller, leaner indices mean faster searches, aggregations, and dashboard loads. By reducing MTTR, this directly improves the user experience and accelerates incident response.
Increased Signal-to-Noise Ratio: This is the most critical benefit. Removing predictable, high-volume "noise" makes it exponentially easier for analysts to spot genuine anomalies, security threats, and performance degradation. You're no longer looking for a needle in a haystack but systematically removing most of the hay.
Reduced Analyst Fatigue: A cleaner, more relevant dataset makes the job of a security or network analyst less tedious and more effective. They can focus on investigation and resolution instead of wading through seas of irrelevant data.
Every organization has sources of "known noise". By strategically identifying and excluding these knowns, you free up human and machine resources to focus on the unknowns that truly matter. The following table outlines common scenarios where filtering is beneficial and essential.
Filtering Scenario | Type of Traffic | Rationale | Key Benefit(s) |
|---|---|---|---|
Segmented VLANs | Camera, Printer, Guest WiFi, IoT devices | Traffic is often high-volume, predictable, and irrelevant for security or performance analysis of core services. | Reduced Storage, Improved Query Performance |
"Chatter" Protocols | SNMP Polling, mDNS/SSDP Discovery, NTP | These protocols generate constant, low-value background noise that can obscure more significant events. | Increased Signal-to-Noise Ratio, Reduced Storage |
Internal Scans & Backups | Vulnerability Scanners, Internal Health Checks, Data Replication Jobs | Traffic is expected, authorized, and can create massive spikes in data that hide real attack patterns or performance issues. | Higher Quality Alerts, Faster Incident Triage |
Step-by-Step Recipes for Filtering ElastiFlow Records
Let's move from theory to practice. The following recipes provide copy-paste-ready examples for intelligently filtering your ElastiFlow data. All examples assume you have configured the ElastiFlow collector to send data in the Elastic Common Schema (ECS) format by setting EF_OUTPUT_ELASTICSEARCH_ECS_ENABLE: 'true'.
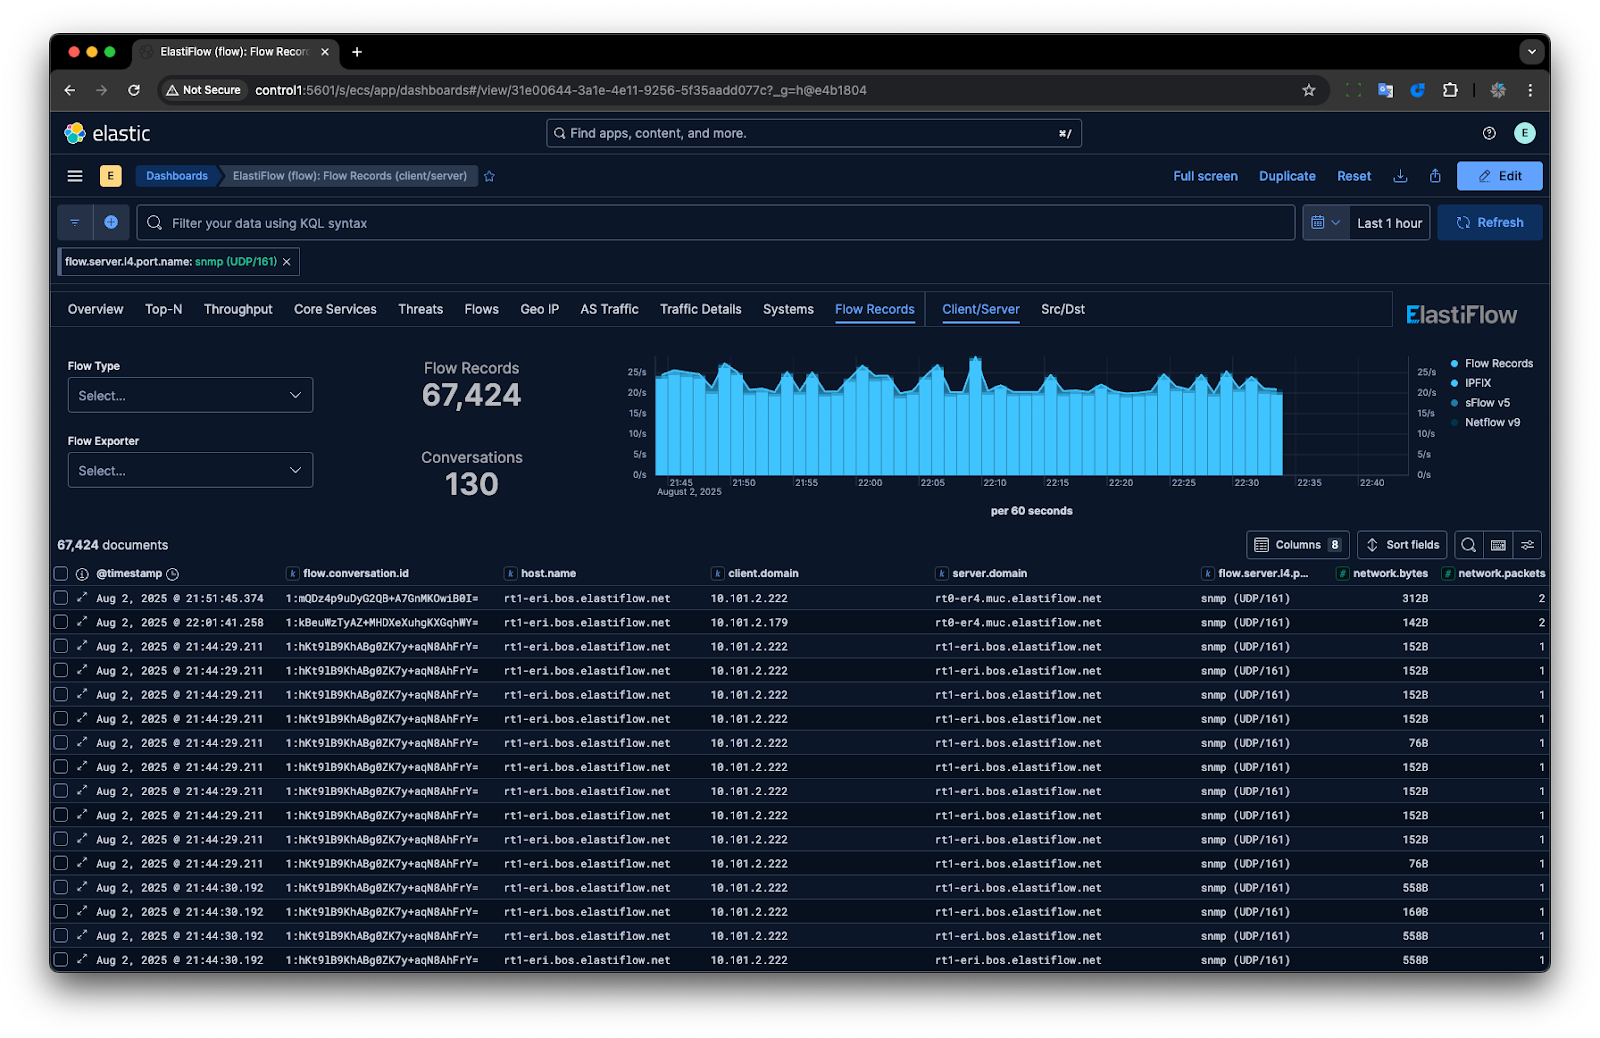
Recipe 1: The Simple Kill, Dropping SNMP Polling Traffic
Our first target is Simple Network Management Protocol (SNMP) polling traffic. This classic example of high-volume, low-value "chatter" can clutter your dataset. We'll create a pipeline to drop any flow record destined for the standard SNMP port, 161.
The Logic: We will use a drop processor with a simple if condition that checks the value of the ECS field server.port.
Implementation Steps:
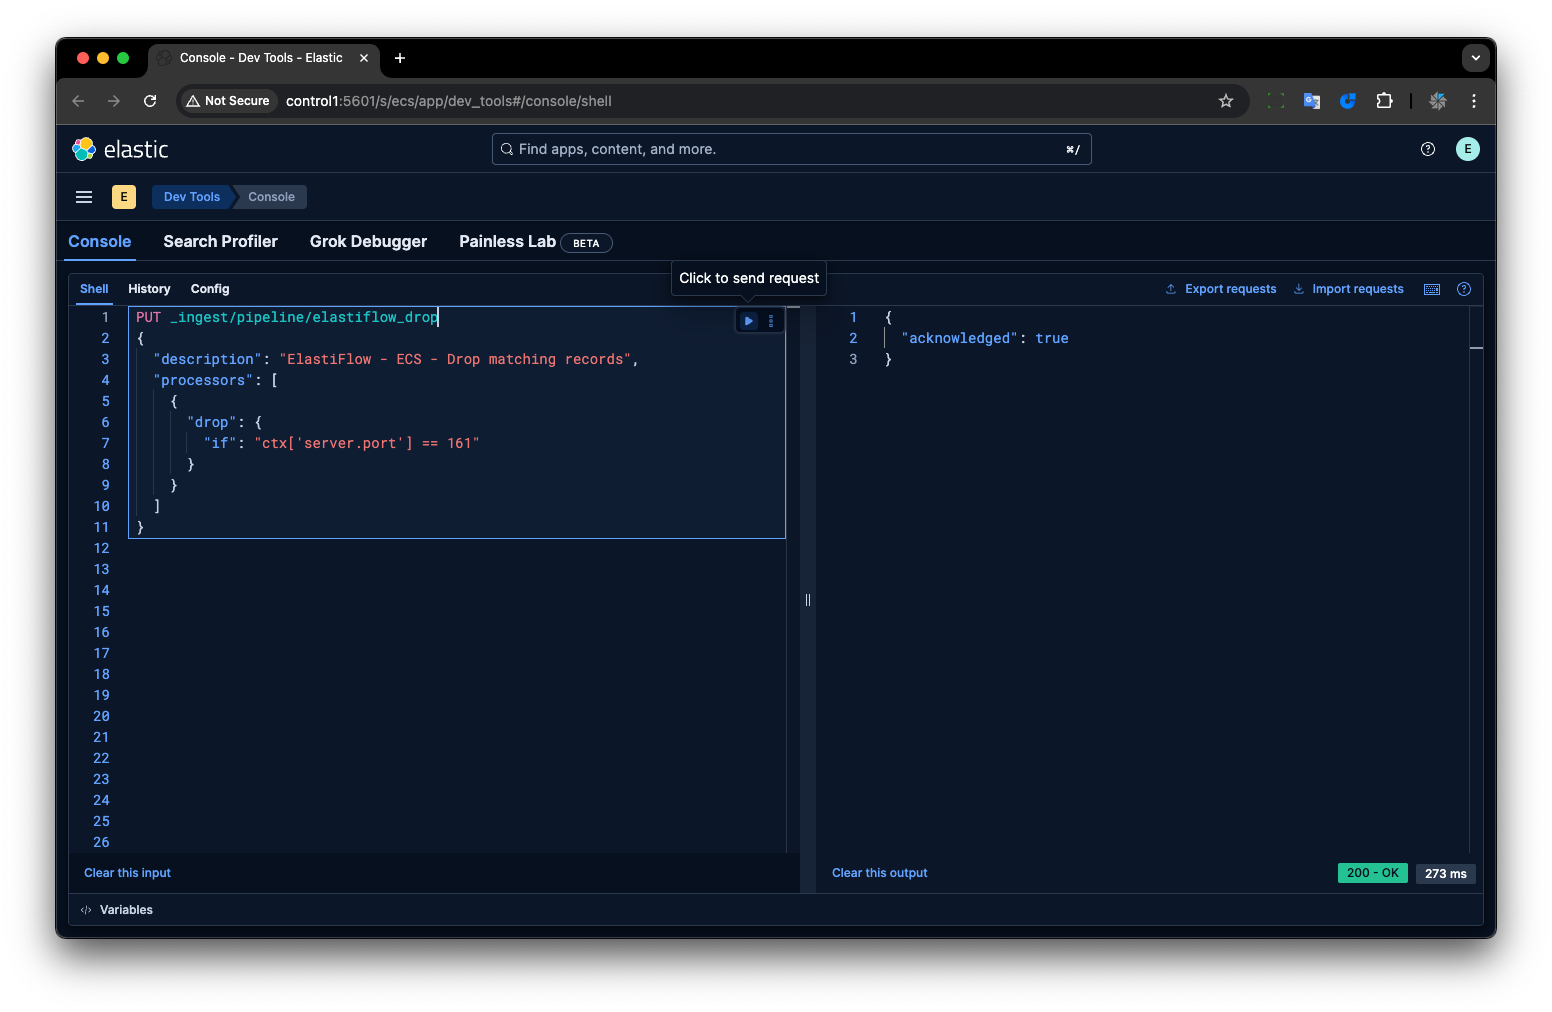
Create the Pipeline:
Using the Kibana Dev Tools Console, execute the following API call to create the ingest pipeline.
1 2 3 4 5 6 7 8 9 10 11PUT _ingest/pipeline/elastiflow_drop { "description": "ElastiFlow - ECS - Drop matching records", "processors": [ { "drop": { "if": "ctx['server.port'] == 161" } } ] }
2. Apply to New Indices:
To ensure this pipeline is automatically applied to all new indices created by ElastiFlow, you must configure the collector to include the final_pipeline setting in its index templates. Set the following environment variable for your ElastiFlow collector instance:
1EF_OUTPUT_ELASTICSEARCH_INDEX_TEMPLATE_PIPELINE_FINAL: 'elastiflow_drop'
3. Apply to Existing, Active Indices:
You need to apply the setting directly to indices that have already been created and are still being written. Replace <INDEX_NAME> with the name of your active write index (e.g. elastiflow-flow-ecs-8.0-2.5-rollover-0000231).
1 2 3 4 5 6PUT <INDEX_NAME>/_settings { "index": { "final_pipeline": "elastiflow_drop" } }
After the ingest pipeline is applied, the SNMP traffic flow records will be dropped.
Recipe 2: The Smart Takedown, Excluding CIDR Blocks with ElastiFlow UDM
Our next scenario is more complex: We want to exclude all traffic to or from specific subnets, such as those dedicated to security cameras, guest WiFi, or printers.
The Challenge: The Performance Trap of Painless CIDR Matching
The "obvious" approach might be to write a complex Painless script within the ingest pipeline that checks if source.ip or destination.ip falls within a list of CIDR ranges. This is a performance trap. As the Elasticsearch engineering team documented, this method is computationally expensive at scale. Each check requires parsing the IP address string and performing CIDR math. When your ingest nodes are processing tens of thousands of documents per second, this overhead adds up quickly, consuming significant CPU and slowing down your entire ingest process.
The "Tag and Bag" Solution: A Superior Approach
A far more elegant and performant solution involves a two-step "Tag and Bag" process. We leverage each component of the stack for what it does best:
Tag: Use the ElastiFlow collector's User-Defined Metadata (UDM) feature to "tag" records whose IP addresses fall within our target CIDRs. The collector is highly optimized for this kind of network-level analysis.
Bag: Use a simple and efficient check in our Elasticsearch ingest pipeline to "bag" (drop) any record with this tag.
This approach follows the principle of Separation of Concerns. At the ingest node, we transform an expensive, stateful operation (CIDR matching) into a cheap, stateless one (a simple string comparison).
Implementation Steps:
Tagging: Configure ElastiFlow User-Defined Metadata (UDM)
Create a metadata file at /etc/elastiflow/metadata/ipaddrs.yml on your collector host with the following content, listing all CIDRs you wish to exclude:
1 2 3 4 5 6 7 8 9 10 11192.168.2.0/24: metadata: ingest_action: 'DROP' 192.168.200.0/24: metadata: ingest_action: 'DROP' 10.10.0.0/20: metadata: ingest_action: 'DROP'
Enable the UDM feature by setting the following environment variables for your ElastiFlow collector:
1 2EF_PROCESSOR_ENRICH_IPADDR_METADATA_ENABLE: 'true' EF_PROCESSOR_ENRICH_IPADDR_METADATA_USERDEF_PATH: '/etc/elastiflow/metadata/ipaddrs.yml'
2. Bagging: Update the Elasticsearch Pipeline
We have now updated our elastiflow_drop pipeline to handle both our original SNMP rule and this new CIDR-based one. This single, consolidated pipeline is more efficient and easier to manage.
Execute the following in the Kibana Dev Tools Console. This will overwrite the previous pipeline definition with an updated version that includes both processors.
1 2 3 4 5 6 7 8 9 10 11 12 13 14 15 16PUT _ingest/pipeline/elastiflow_drop { "description": "ElastiFlow - ECS - Drop matching records", "processors": [ { "drop": { "if": "ctx['server.port'] == 161" } }, { "drop": { "if": "ctx.containsKey('ingest_action') && ctx['ingest_action'] == 'DROP'" } } ] }
The second drop processor is now incredibly efficient. It performs a simple check for the existence of the ingest_action key and compares its value to DROP. This is orders of magnitude faster than performing IP address math at ingest time, allowing you to scale your filtering rules without impacting cluster performance.
From Data Overload to Actionable Insight
We've journeyed from the core problem of data deluge to a practical solution for strategic filtering. Curation is not censorship; it's the art of refining your dataset to maximize its value. By leveraging Elasticsearch ingest pipelines, you can take firm control of your data flow, dramatically reducing costs and boosting the performance of your entire observability platform.
We demonstrated two powerful techniques:
Simple field-based dropping for everyday, easily identifiable chatter.
The advanced "Tag and Bag" approach for efficiently handling complex rules like CIDR exclusion is a method that is both highly performant and scalable.
Stop letting your data drown you. Take control of your ingest pipelines, curate your dataset with intention, and transform your network observability platform from a costly data swamp into a source of clear, actionable insight. Your analysts and your budget will thank you.
Stay connected
Sign up to stay connected and receive the latest content and updates from us!