In a cloud-native world, the network is just another piece of software. It is programmable, dynamic, and the responsibility of the same team managing the observability pillars. If you run Kubernetes in production, you are effectively a network engineer because touching a CNI plugin or a service mesh means inheriting the network.
However, while we have empowered DevOps engineers to own the entire application lifecycle, we have left them with 2010-era network tools.
We have Prometheus for metrics, Loki for logs, and distributed tracing to follow requests across microservices. We can find the p99 latency of an API endpoint or identify a slow database query in seconds. But the moment a problem lives in the space between pods, we are reduced to a shrug and a "bytes in, bytes out" dashboard. The lack of network visibility leaves a massive gap in the current stack.
The Gap in MELT
We have spent the last decade building the MELT stack: metrics, events, logs, and traces. These four pillars are intended to provide complete visibility. However, there is a fifth pillar that remains hidden in the shadows: the pillar that connects everything else, network flow data.
DevOps has visibility into application performance but lacks deep network understanding.
NetOps sees raw IP addresses and ports but lacks the critical application context.
Traditional tools are siloed, leaving engineers with "bytes in, bytes out" dashboards that fail to explain network spans.
Why Network Flow Data is the Fifth Pillar of Observability
Network flow data connects metrics, events, logs, and traces to provide visibility into the space between pods. While APM tools are often blind to the network layer, flow data reveals if delays are caused by packet loss, TCP connection queuing, or failed establishments.
When a distributed trace shows a 500ms network span between two services, what actually happened? Was it packet loss or heavy retransmissions? Was there a TCP connection queuing delay? Did the connection even establish properly before the timeout?
Application Performance Monitoring (APM) tools are blind to the network layer, leaving DevOps teams in the dark. Simultaneously, traditional network teams are siloed, examining raw IP addresses and port numbers in separate tools. They might spot a traffic spike, but identifying the actual cause remains a mystery.
Why is eBPF the Preferred Technology for Flow Capture?
eBPF(Extended Berkeley Packet Filter) enables kernel-level traffic capture without the need for service mesh sidecars or per-application configuration. It provides the "sweet spot" of flow data without the massive storage costs of full packet capture. Flow data provides connection-level detail with timing information, TCP flags, and state tracking, but is aggregated enough to be practical for every single connection in your cluster.
When flows are exported as OpenTelemetry trace spans, they slot right into the existing infrastructure. OpenSearch and Grafana Tempo instances, for example, can now store network flows alongside application traces. The same retention policies, the same query language, and correlation capabilities apply.
Benefits of Connection-Level Flow Data
The goal is not to magically turn every DevOps engineer into a network expert. The goal is to enable DevOps with the visibility they need in the tools they already have.
With Kubernetes, the network is no longer infrastructure managed by someone else. It is part of the application platform. When a request fails, you should see it in your existing dashboards, correlated with the traces you already see.
To achieve true full-stack observability, engineers must integrate network data into their existing data pipeline. Connection-level flow data provides three critical advantages:
Correlation: Correlate slow traces with actual network behavior. The 500ms span might consist of 50ms for connection establishment, 400ms for waiting for data, and 50ms for transfer with three retransmissions. Now you know the problem is on the receiving end, not the network path itself.
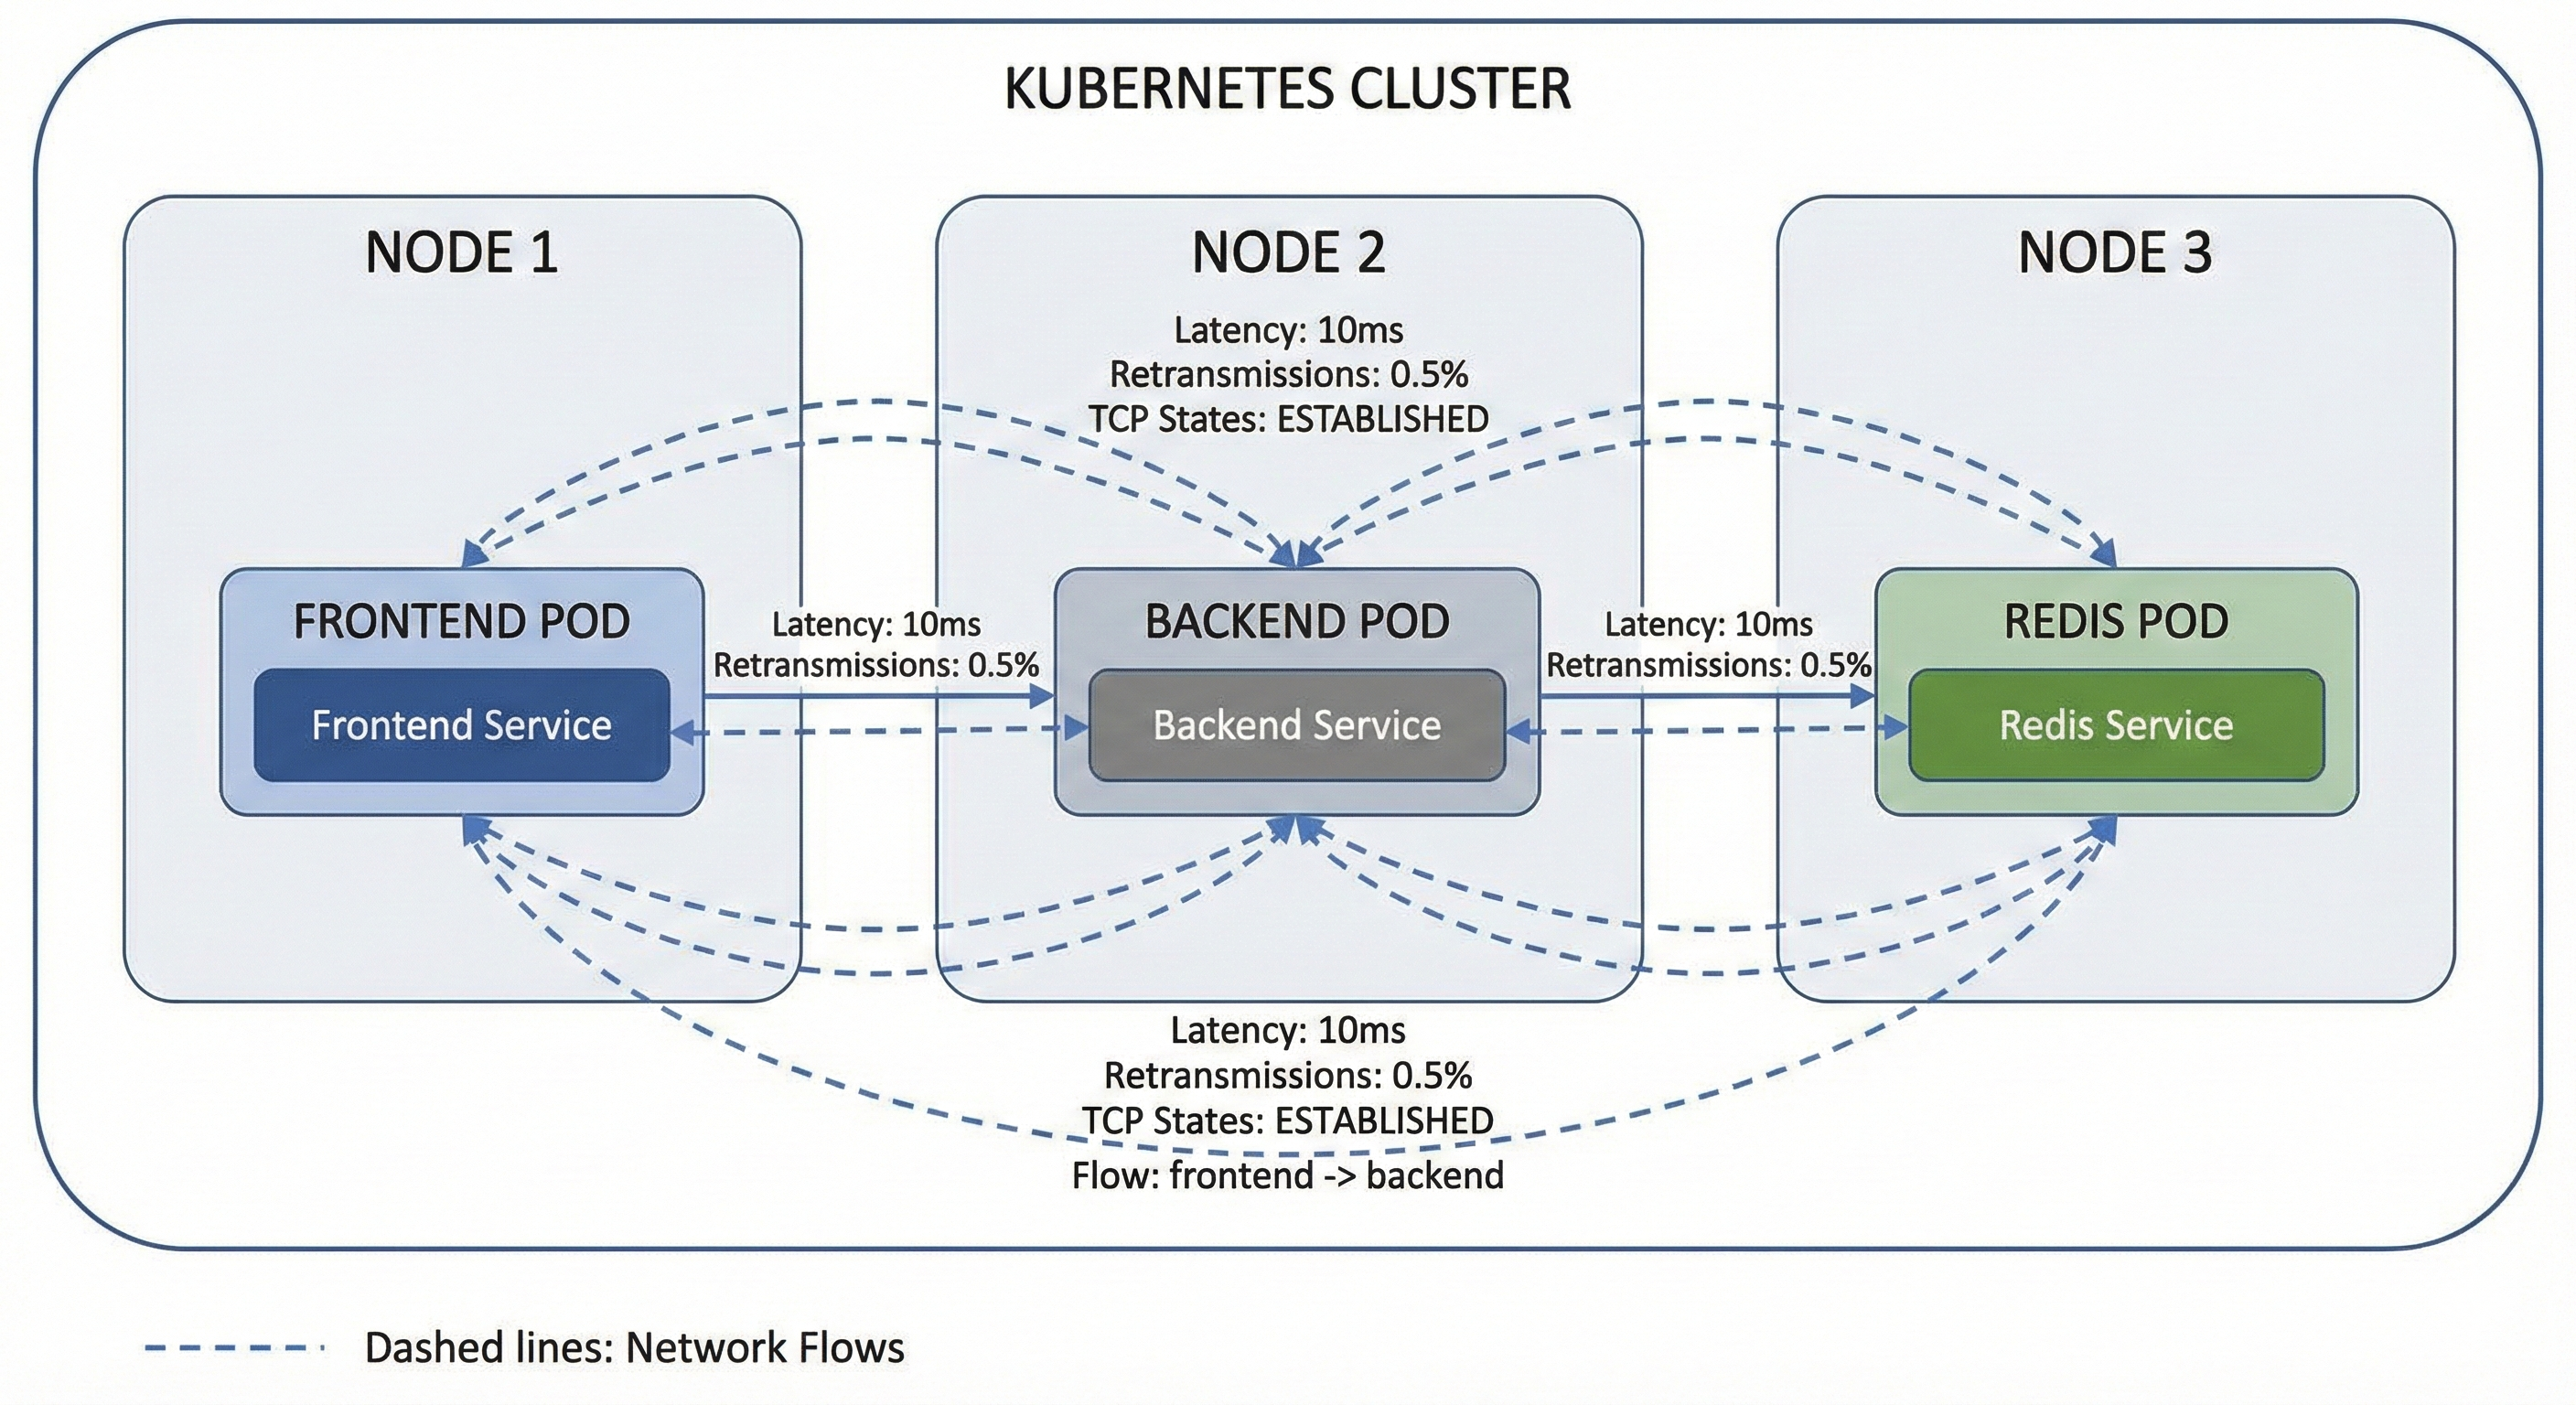
Kubernetes-Native Context: Map traffic directly to application topology. Flows should show that your frontend deployment is communicating with your Redis service on port 6379, not just that 10.42.0.5 is communicating with 10.42.0.8.
Unified Querying: Run complex queries across network and application data in a single system. For example: "Show me all flows where response time exceeded 100ms and the application trace shows database latency under 10ms." Those are clearly network problems, not database problems.
Auto-Instrument Kubernetes Network Traffic with Mermin
Mermin fits into your existing stack by leveraging the standards you already use. OTLP output means it works with whatever trace backend you have deployed. eBPF capture means it works regardless of your programming language, framework, or CNI.
Mermin is deployed once per node as a DaemonSet. It captures the traffic, enriches it with Kubernetes metadata, and exports it as trace spans. There are no application changes or complex configurations per service.
Pull the network out of the shadows and into the same observability stack where you already live.
Related Links:
Stay connected
Sign up to stay connected and receive the latest content and updates from us!