If you're reading this, you likely already know there’s a network observability gap in Kubernetes. The siloed worlds of Application Performance Monitoring (APM) and Network Performance Monitoring (NPM) create blind spots that make troubleshooting, security forensics, and performance optimization challenging. Mermin breaks down this barrier by translating network flows into OpenTelemetry format. With Mermin, network data and application performance data can both speak the same language. This unified format enables teams to more easily correlate traffic patterns and achieve more thorough observability across both application and network layers in Kubernetes environments.
But what does this look like in practice? How do teams leverage network observability to address real challenges? This blog explores several use cases where Mermin’s network flow data fundamentally changes how teams troubleshoot issues, investigate security incidents, optimize performance, and manage their Kubernetes infrastructure.
Real-World Use Cases
Troubleshooting Connectivity Issues
When one service can’t reach another, Mermin reveals what’s actually happening at the network layer. You can determine if packets are sent but not received, trace the specific traffic path, identify whether connections are functioning or failing, and measure how much data is flowing. This granular network view fills in gaps that logs and traces leave behind.
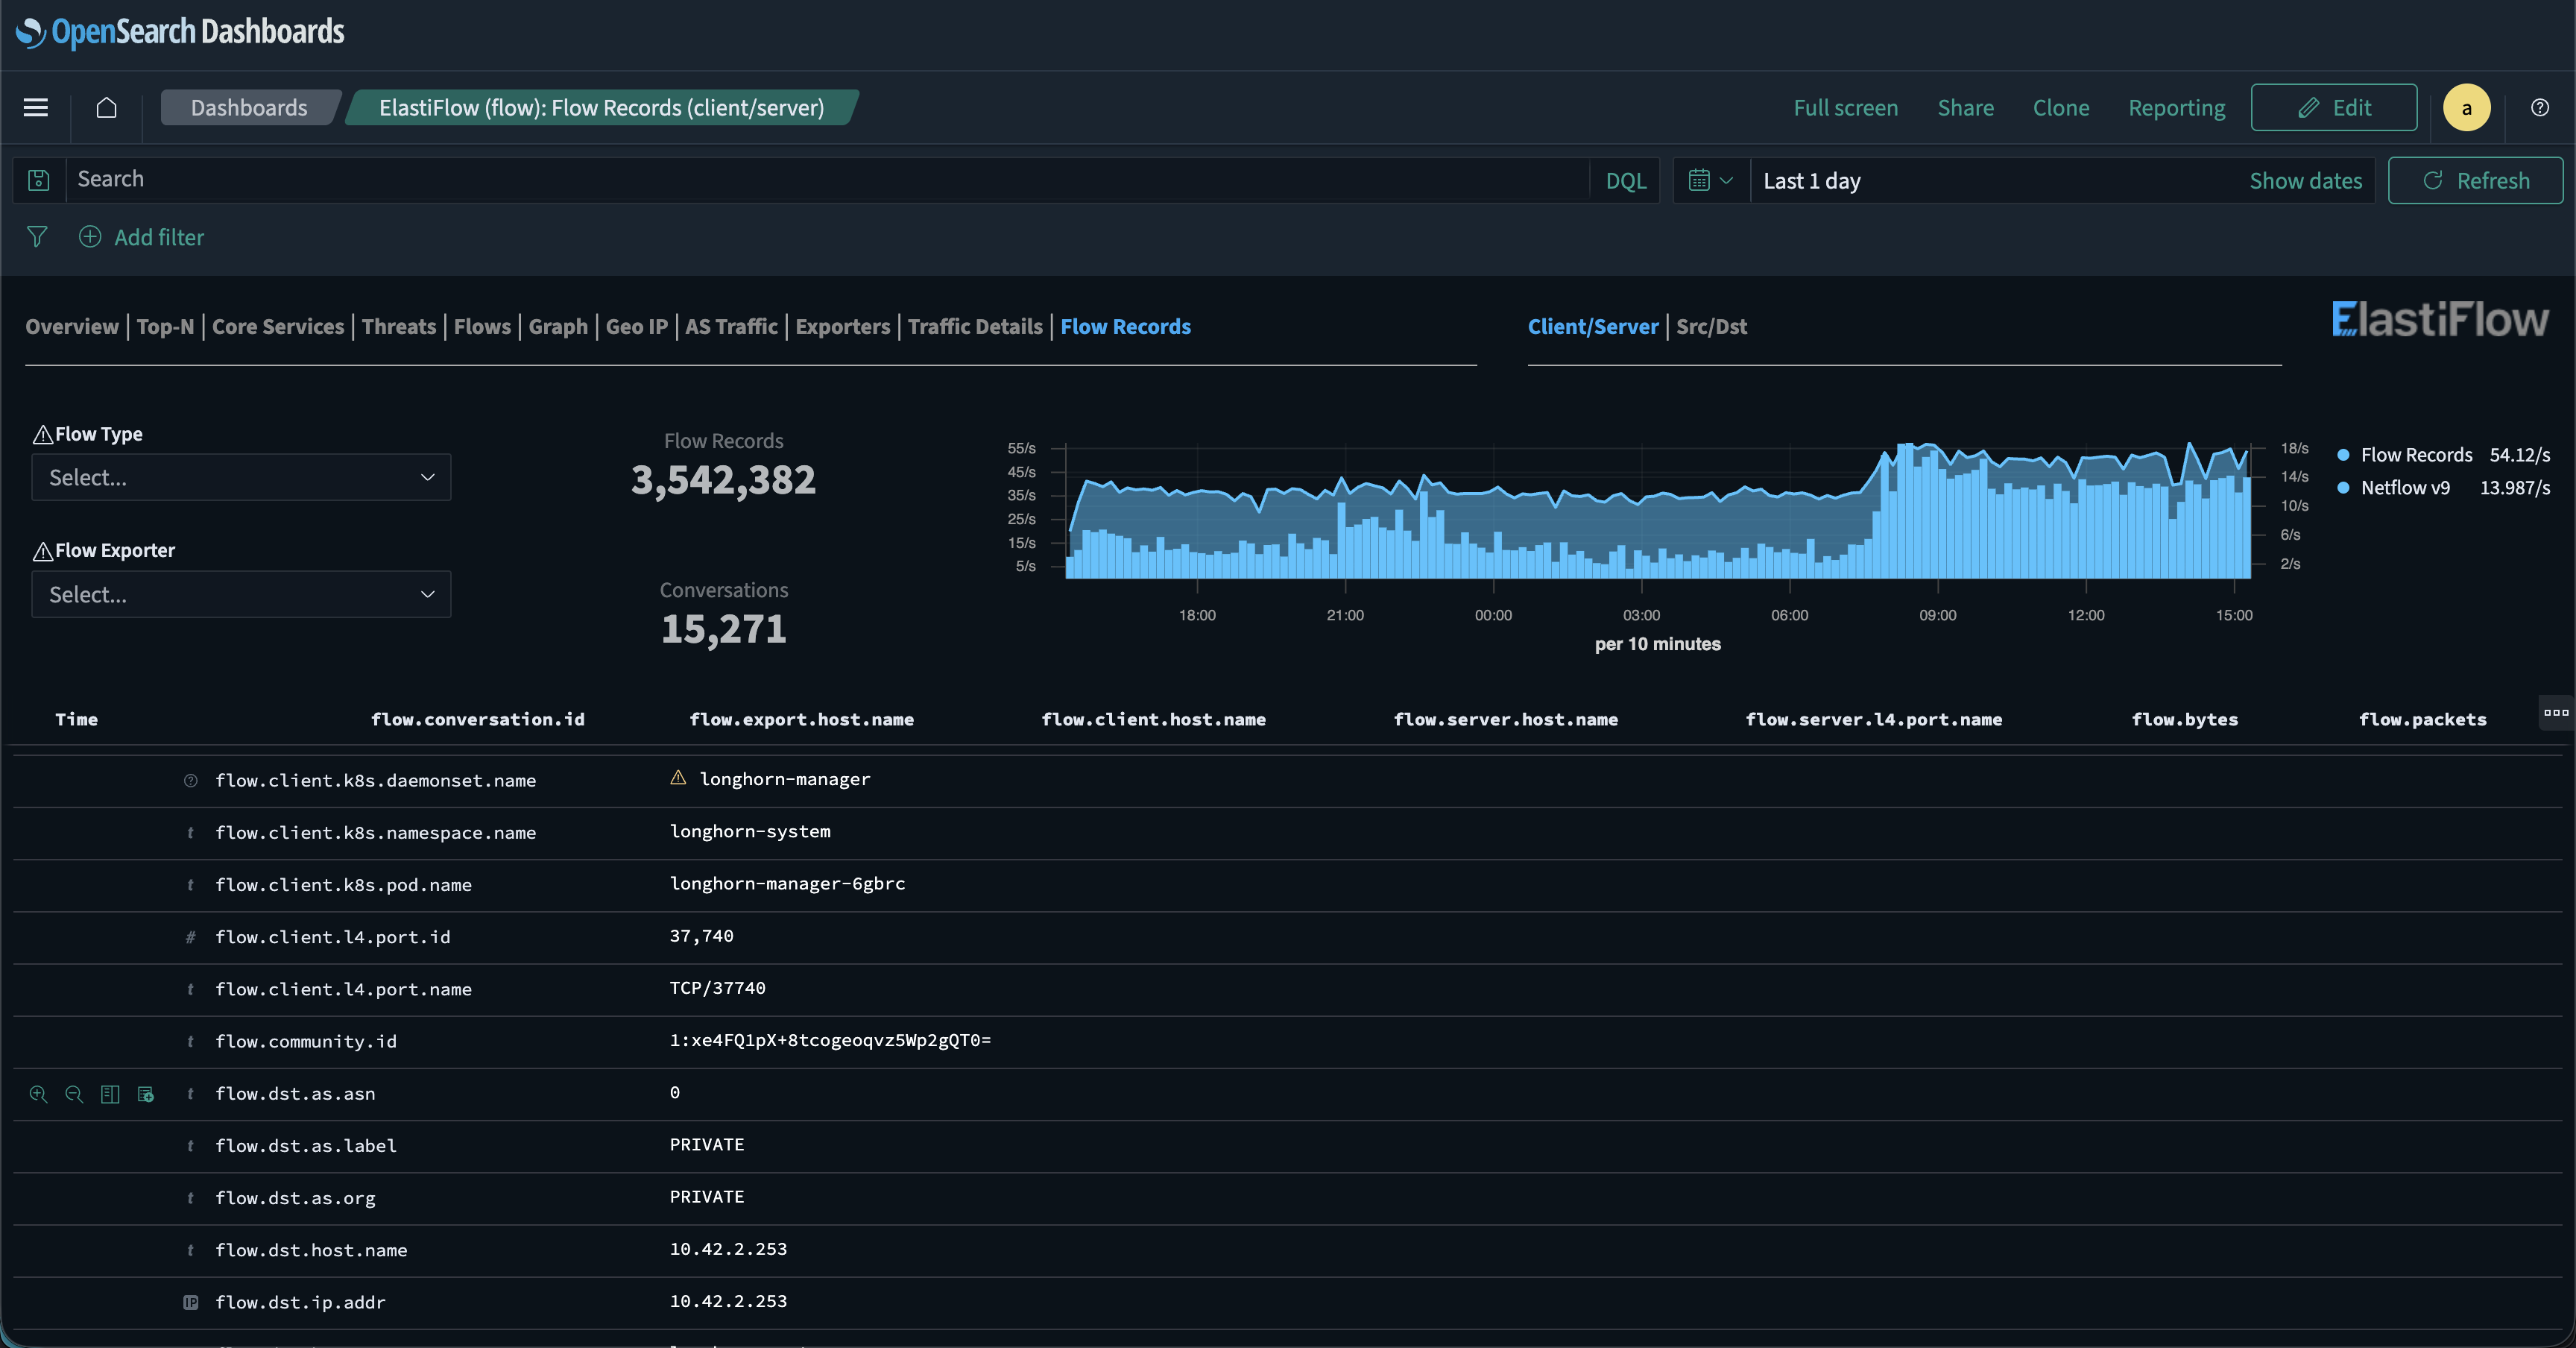
Analyzing Flow Records at Scale
Handling millions of network flows each day can make finding the connections that matter feel like searching for a needle in a haystack. Traditional network tools show IP addresses and ports, but that’s often not enough when pods are recreated every few hours and IP addresses are constantly changing.
Mermin’s flow records dashboard captures these changes in real time. With OpenSearch or Kibana’s field indexing, you can filter by deployment and see every flow record tied to that application.
From there, you can further narrow your search by filtering on protocol, port, source or destination address, and more. This flexibility enables tracking traffic through namespaces, deployments, or even down to individual pod names.
Security Forensics and Compliance
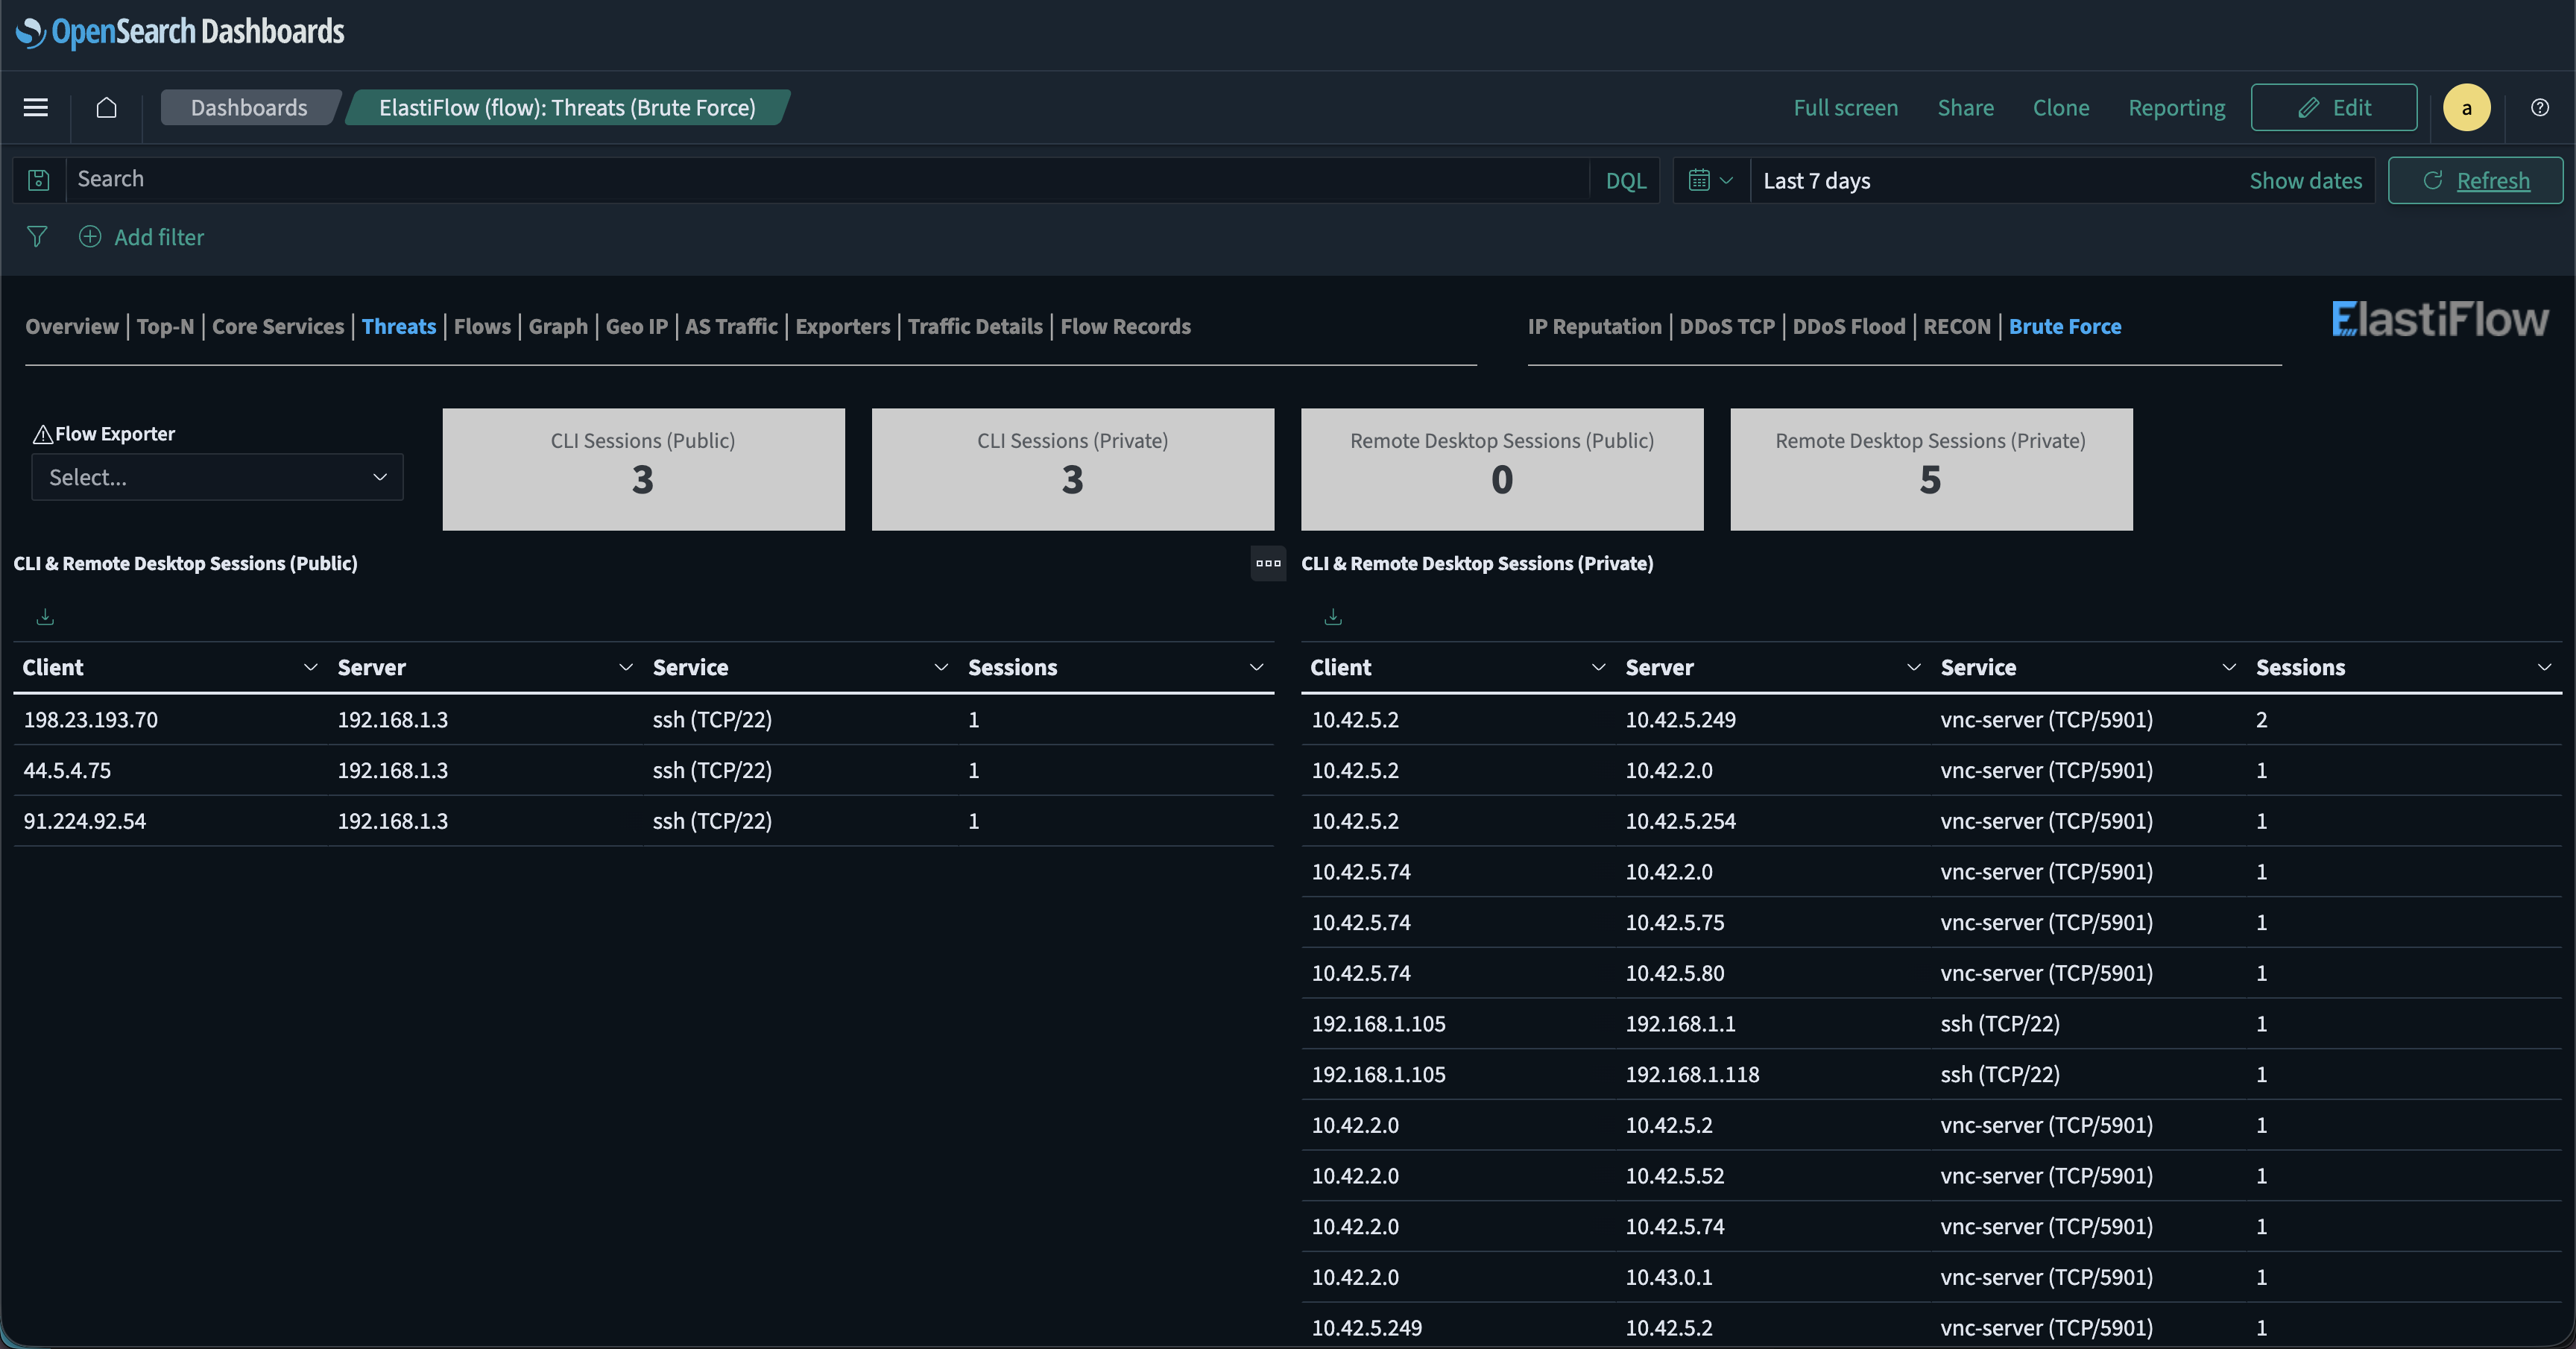
After a security incident, it is crucial to understand who communicated with whom and when. Mermin provides complete network flow records with timestamps, showing all connections between pods, external connections, connection durations, data volumes, and Kubernetes metadata for context.
This flow-level data is essential for security investigations, compliance audits, and understanding the scope of potential breaches. Mermin also builds on NetObeserv’s existing capabilities, providing more data on threat attempts on both your network and your Kubernetes cluster. In the following example, you can see three public attempts to brute force into the Kubernetes cluster’s load balancer. Auditing the public attempts against private attempts can help quickly identify if all successful sessions are authorized and expected.
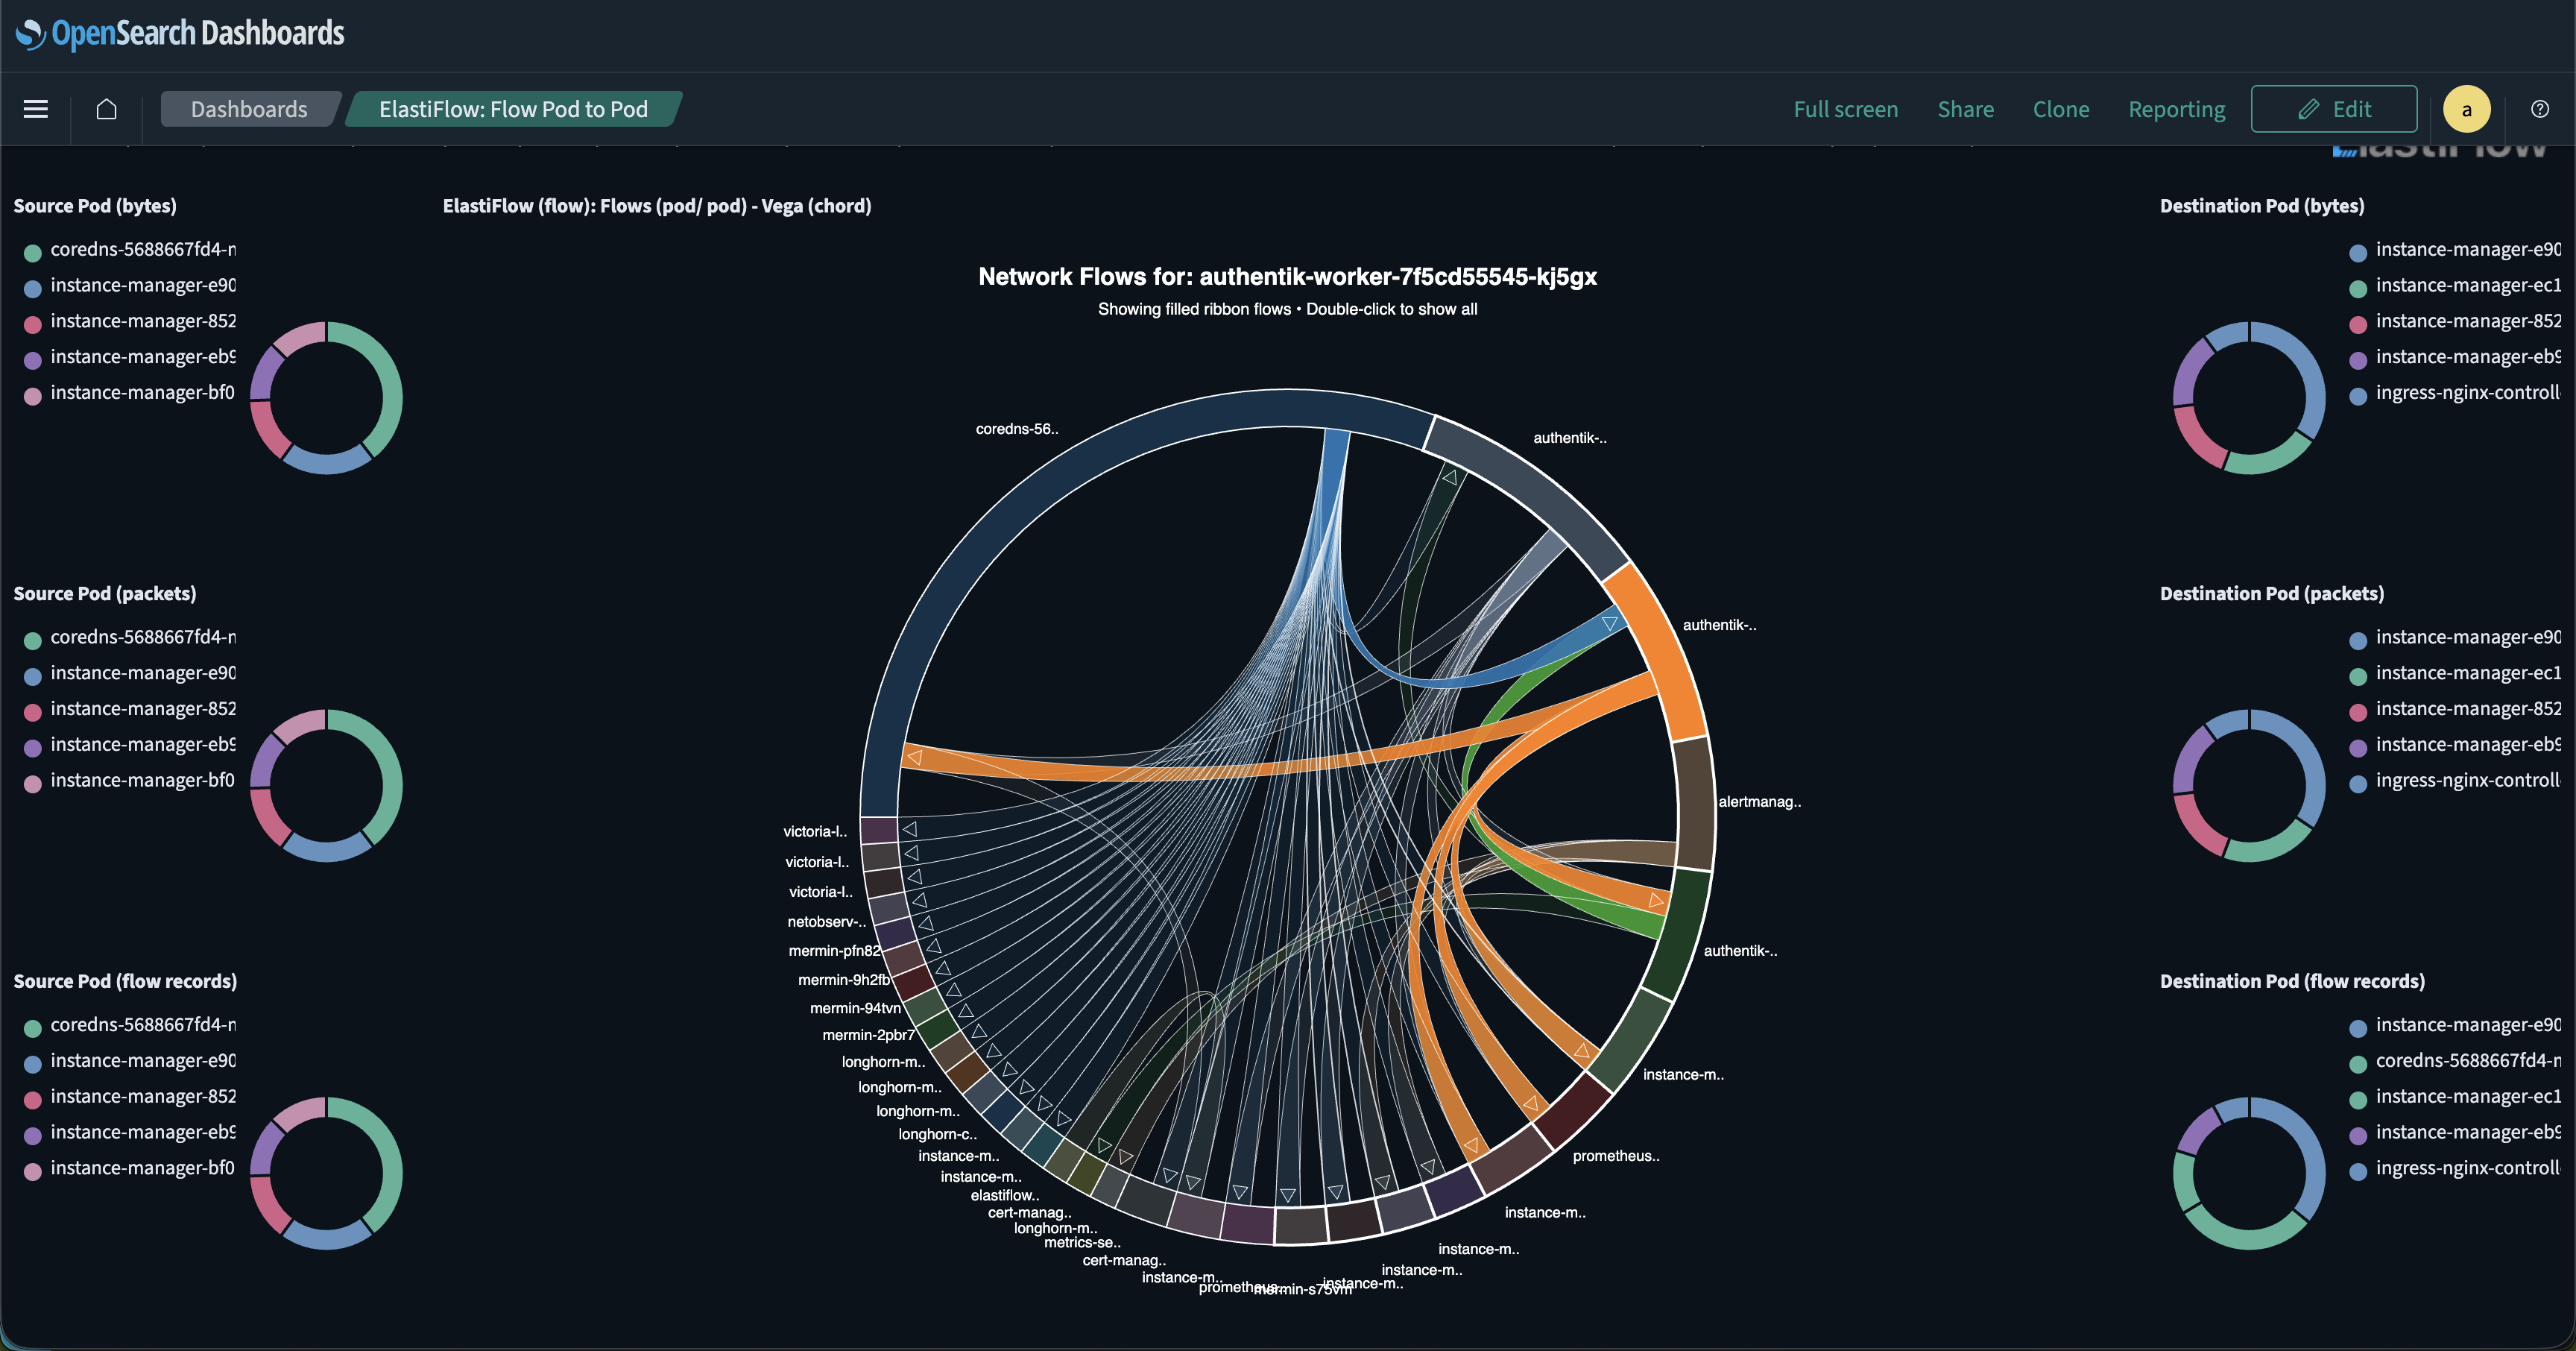
Pod to Pod Traffic Validation
With the flat network that Kubernetes utilizes for pod traffic, it is essential to confirm that pods interact only with other authorized pods. In the following example, the chord chart clearly indicates that the Authentik SSO worker has access only to the pods with which it should be communicating. In this case, you can see it only interacts with storage, DNS, metrics, and the Authentik server itself.
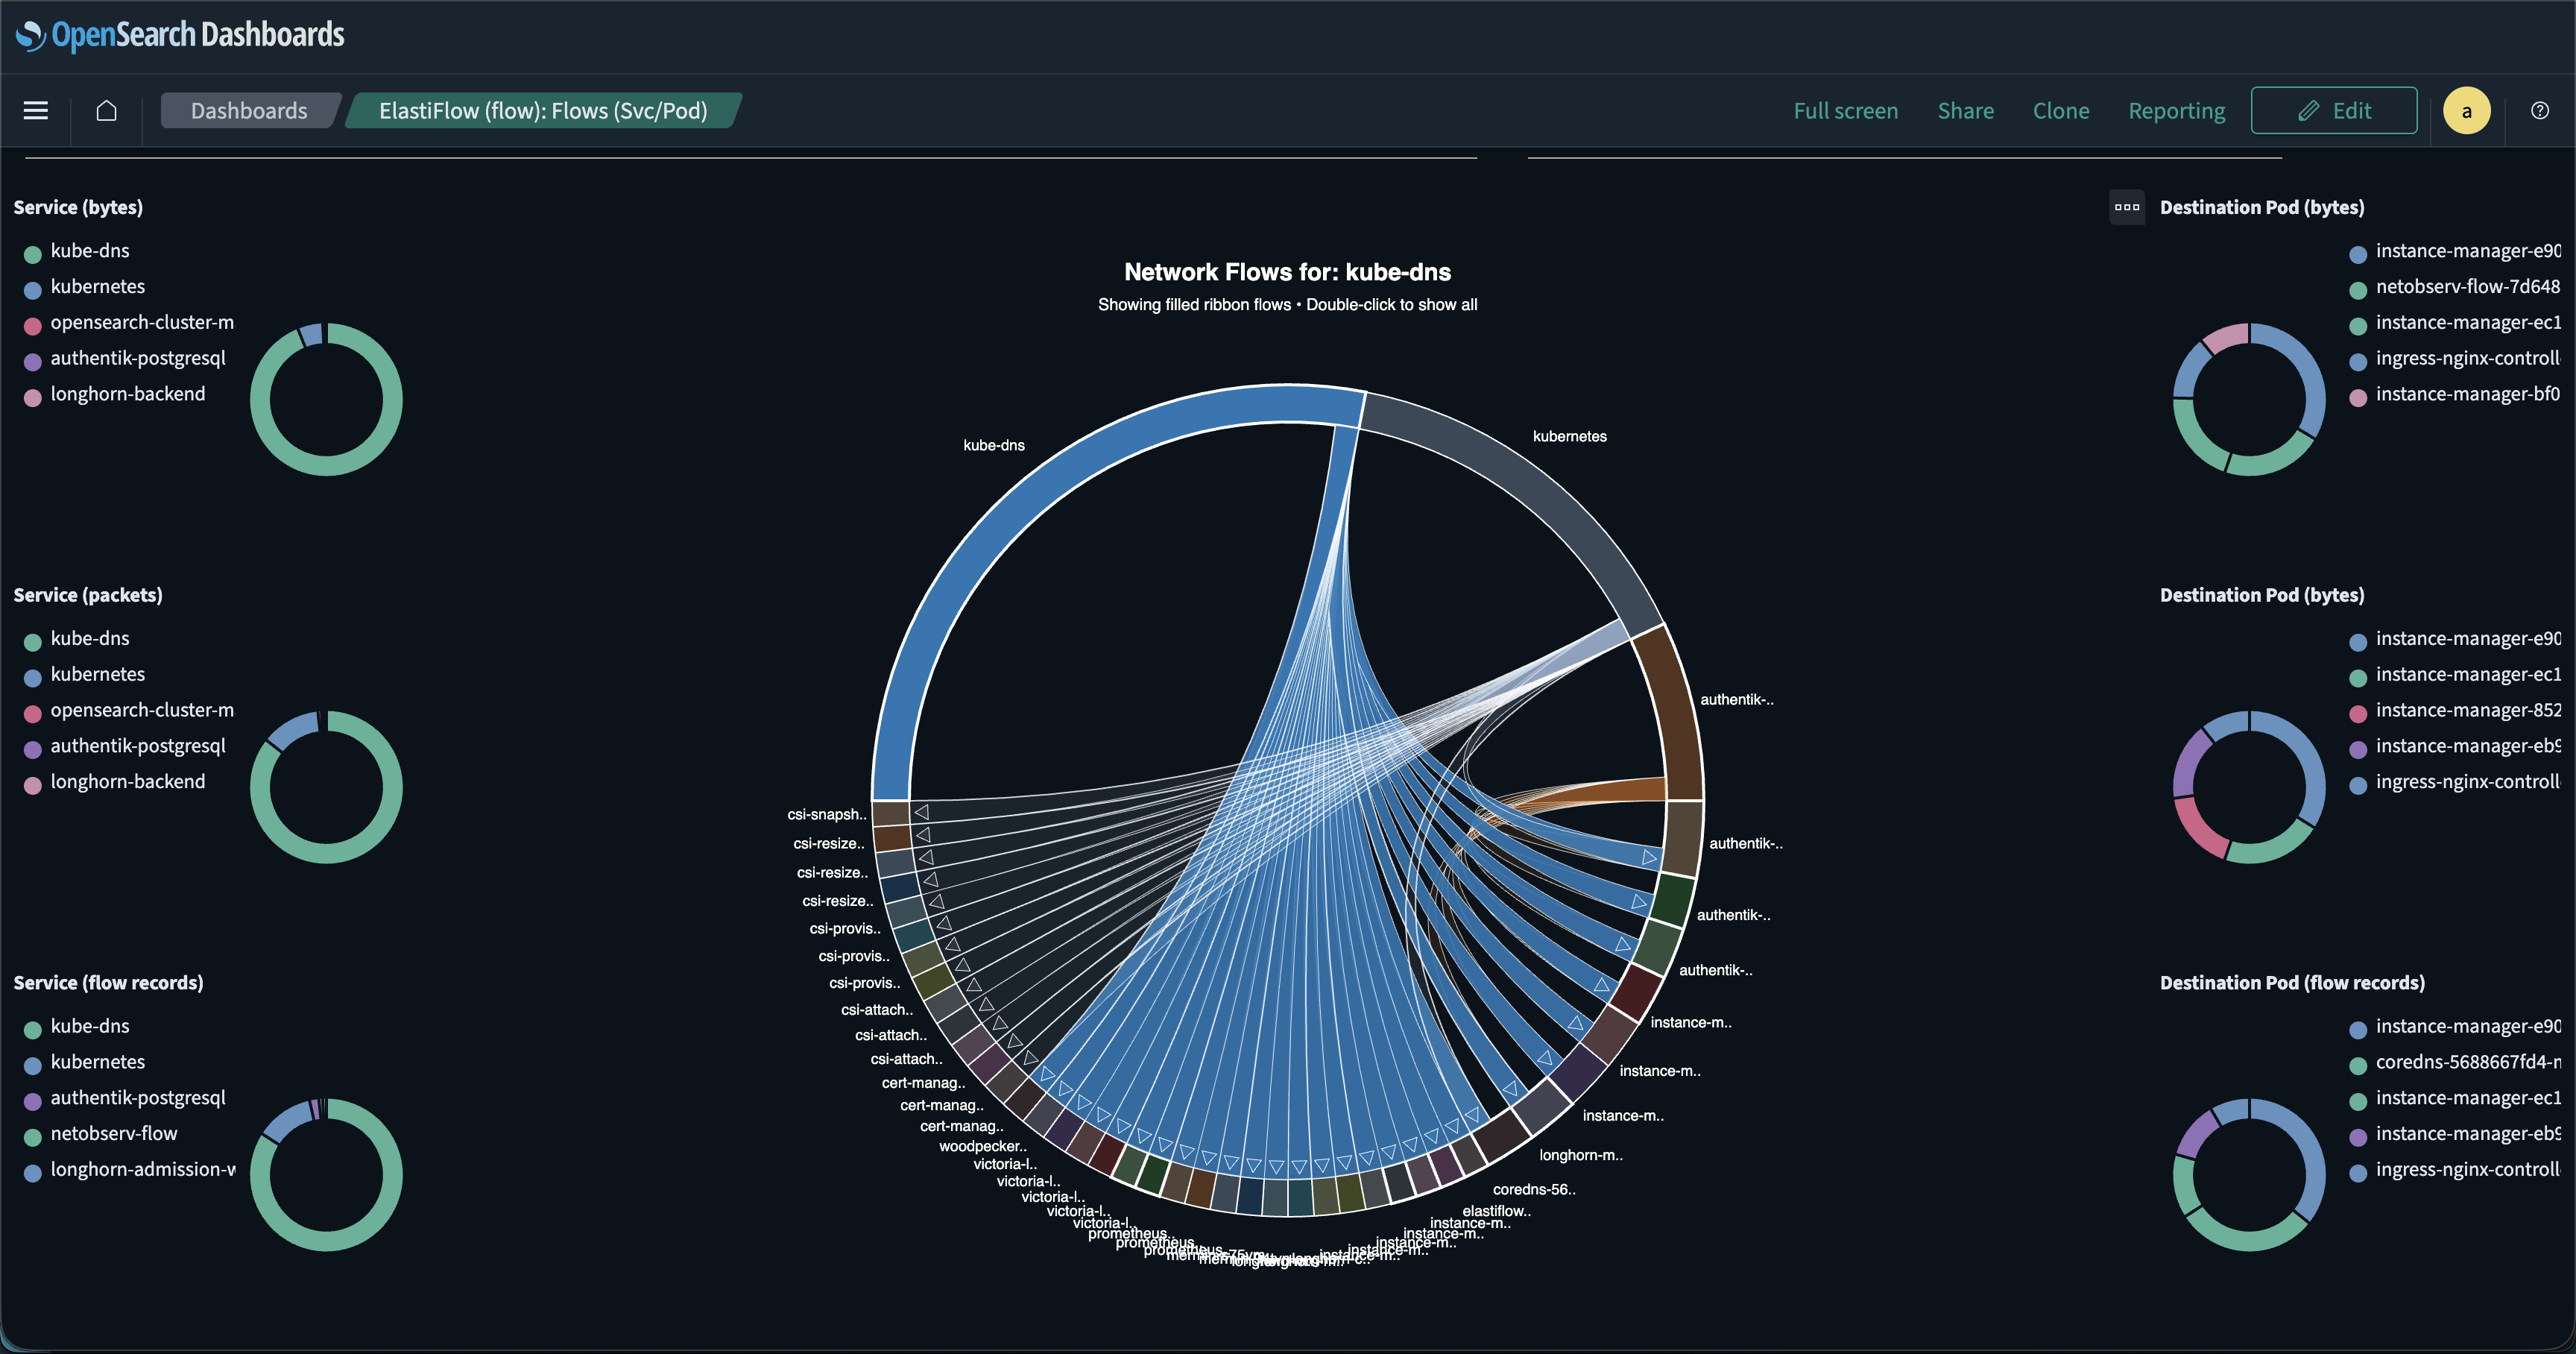
Service Dependency Mapping
Understanding service dependencies is critical for impact analysis and change management. It also helps pinpoint loud talkers on the network. Mermin automatically maps network dependencies by tracking all flows between services. See which services communicate, the volume and frequency of communication, and network paths. This mapping can help with capacity planning and inform impact assessments as well.
A Unified View on all Network Traffic
For users new to ElastiFlow, Mermin provides a unified view, displaying flow data, including OpenTelemetry (OTel) traces and Kubernetes-specific Flow Records, in a single interface, like the Flow Records Dashboard. This new network flow data automatically enriches any dashboard displaying OTel traces, providing a richer and more comprehensive view of network traffic. For example, the Flow Records Dashboard now lists Kubernetes Flow Records alongside existing flow data.
For current ElastiFlow customers, Mermin uses the same NetObserv dashboards, augmenting them with new flow data from within the Kubernetes cluster. This extends the existing out-of-cluster network insights to include Kubernetes network insights. To get started with ElastiFlow, check out our trial license page.

Completing the Observability Picture
APM tools offer deep application visibility, but lack network visibility. Mermin bridges this gap with flow-level network observability that integrates seamlessly with your existing tools and infrastructure.
With Mermin, you achieve complete observability: logs, metrics, traces, events, and network flow. Visualize all telemetry in unified dashboards. Choose your CNI based on your needs, not observability constraints. Capture network flows transparently at the kernel level with minimal overhead. Use standard OTLP protocols with any compatible backend.
Kubernetes networks don’t have to be opaque. With Mermin, your cluster's network becomes as transparent and manageable as the rest of your observability stack. Network data is available in clear dashboards and diagrams, fully integrated into your existing workflows.
Ready to add network visibility to your Kubernetes cluster? Deploy Mermin and see what is really happening on your network.
Resources
Stay connected
Sign up to stay connected and receive the latest content and updates from us!