What’s ElastiFlow?
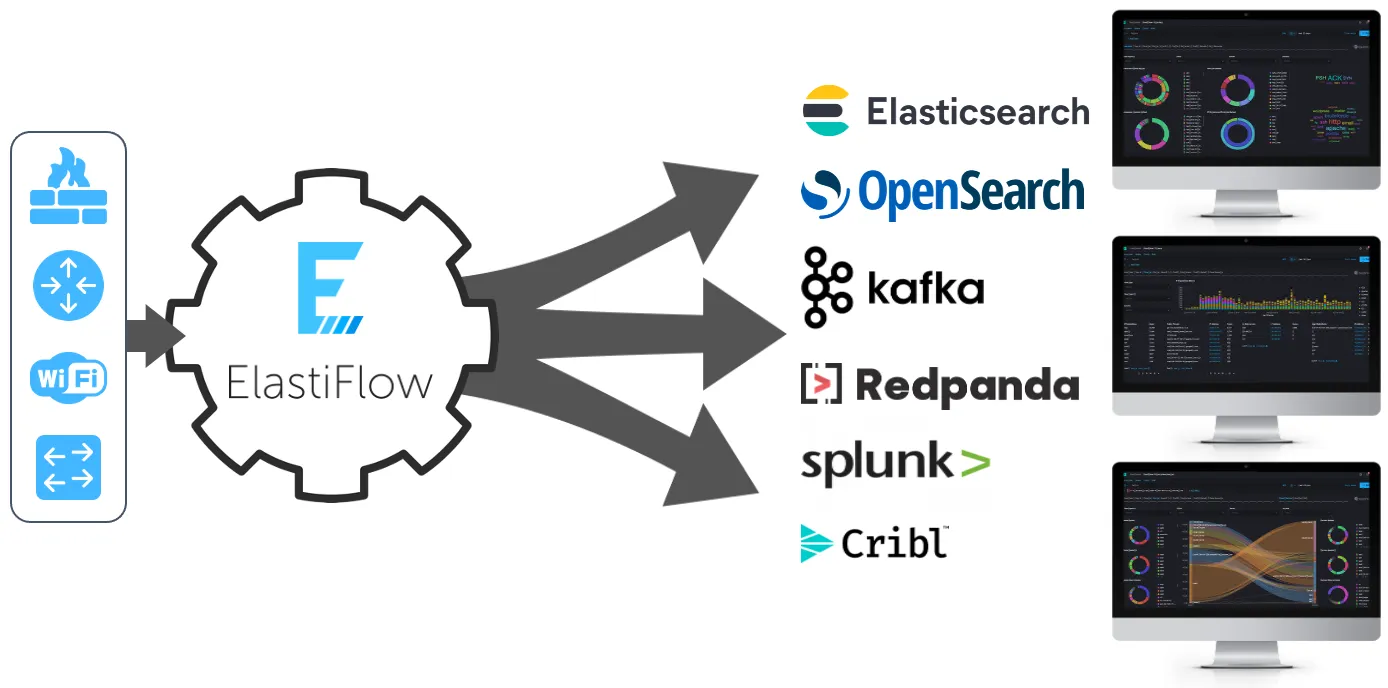
ElastiFlow offers complete network visibility. ElastiFlow collects unsampled flow data and standardizes data from network devices, including industry-leading vendor-specific field support. As well as being easy to set up, it's also easy to use and requires no special training. ElastiFlow takes an open data approach to network observability, meaning you remain in control of your data and can economically leverage this data. ElastiFlow provides powerful analytics tools that allow you to troubleshoot problems, plan capacity, and investigate security incidents.
Getting Ready
Before diving in, ensure you have:
Docker v24.0.7
Docker-compose v2.23.0
A router that supports NetFlow, IPFIX, or sFlow
About Licenses
This guide uses a community license. If your network is large and you aim to collect more data quickly, visit ElastiFlow’s Subscription Page to select the right license for your needs.
Setting Up with Docker-Compose
Your docker-compose.yml file will serve as the core of this setup. Below is a generic setup that brings together Elasticsearch, Kibana, and the ElastiFlow flow collector:
1 2 3 4 5 6 7 8 9 10 11 12 13 14 15 16 17 18 19 20 21 22 23 24 25 26 27 28 29 30 31 32 33 34 35 36 37 38 39 40 41 42 43 44 45 46 47 48 49 50 51 52 53 54 55 56 57 58 59 60 61 62 63 64 65 66 67 68 69 70 71 72 73version: '3' services: es_master1: image: docker.elastic.co/elasticsearch/elasticsearch:8.10.4 restart: unless-stopped hostname: es_master1 ulimits: memlock: soft: -1 hard: -1 nofile: soft: 131072 hard: 131072 nproc: 8192 fsize: -1 network_mode: host volumes: - /var/lib/elasticsearch:/usr/share/elasticsearch/data environment: ES_JAVA_OPTS: '-Xms2g -Xmx2g' cluster.name: elastiflow node.name: es_master1 bootstrap.memory_lock: 'true' network.bind_host: 0.0.0.0 http.port: 9200 http.publish_port: 9200 transport.port: 9300 transport.publish_port: 9300 cluster.initial_master_nodes: 'es_master1' indices.query.bool.max_clause_count: 8192 search.max_buckets: 250000 action.destructive_requires_name: 'true' xpack.security.enabled: 'false' kibana: image: docker.elastic.co/kibana/kibana:8.10.4 restart: unless-stopped hostname: NODE_NAME network_mode: host ports: - 5601:5601/tcp environment: TELEMETRY_OPTIN: 'false' TELEMETRY_ENABLED: 'false' SERVER_NAME: 'NODE_NAME' SERVER_HOST: '0.0.0.0' SERVER_PORT: 5601 SERVER_MAXPAYLOADBYTES: 8388608 ELASTICSEARCH_HOSTS: 'http://localhost:9200' ELASTICSEARCH_REQUESTTIMEOUT: 132000 ELASTICSEARCH_SHARDTIMEOUT: 120000 ELASTICSEARCH_SSL_VERIFICATIONMODE: 'none' KIBANA_AUTOCOMPLETETIMEOUT: 3000 KIBANA_AUTOCOMPLETETERMINATEAFTER: 2500000 VIS_TYPE_VEGA_ENABLEEXTERNALURLS: 'true' XPACK_MAPS_SHOWMAPVISUALIZATIONTYPES: 'true' XPACK_ENCRYPTEDSAVEDOBJECTS_ENCRYPTIONKEY: 'ElastiFlow_0123456789_0123456789_0123456789' flow-collector: image: elastiflow/flow-collector:6.3.6 container_name: flow-collector restart: 'unless-stopped' network_mode: 'host' volumes: - /etc/elastiflow:/etc/elastiflow environment: EF_LICENSE_ACCEPTED: 'true' EF_FLOW_SERVER_UDP_IP: '0.0.0.0' EF_FLOW_SERVER_UDP_PORT: 9995 EF_OUTPUT_ELASTICSEARCH_ENABLE: 'true' EF_OUTPUT_ELASTICSEARCH_ECS_ENABLE: 'true' EF_OUTPUT_ELASTICSEARCH_TIMESTAMP_SOURCE: 'start' EF_OUTPUT_ELASTICSEARCH_INDEX_PERIOD: 'rollover'
Make sure to tailor this docker-compose file to fit your specific needs. For detailed configuration guidance, you can review the ElastiFlow Configuration Reference.
When running your Elasticsearch container, you might encounter the following bootstrap check failure that prevents the service from starting.
1 2 3bootstrap check failure [1] of [1]: max virtual memory areas vm.max_map_count [65530] is too low, increase to at least [262144]", "ecs.version": "1.2.0","service.name":"ES_ECS","event.dataset":"elasticsearch.server","process.thread.name" :"main","log.logger":"org.elasticsearch.bootstrap.Elasticsearch","elasticsearch.node.name" :"es_master1","elasticsearch.cluster.name":"elastiflow
To solve this, increase the vm.max_map_countfield in your sysctl.conf, then restart the Elasticsearch container.
1echo 'vm.max_map_count=262144' | sudo tee -a /etc/sysctl.conf sudo sysctl -p
Wrapping It Up
With your configurations in place, initiate the services using the command docker-compose up. Remember to configure your supported router to forward flows to port 9995.
Kibana Dashboards: To enhance your monitoring experience, download and upload ElastiFlow’s pre-defined ECS (Elastic Common Schema) Kibana dashboards. These dashboards offer a detailed view of your network flows, aiding in identifying patterns, anomalies, or potential issues more effectively. Access and integrate these ECS dashboards by following the instructions in the official ElastiFlow Kibana Dashboards Guide.
Final Words
As a software engineer on ElastiFlow, I’ve experienced firsthand how this tool has empowered businesses. It provides real-time insights, streamlines network analysis, and simplifies troubleshooting. Whether you’re in banking, healthcare, or any other sector, ElastiFlow can make a big difference. Dive in and explore what your network data can reveal! If you need help, join the ElastiFlow Slack Community https://elastiflowcommunity.slack.com
(Note: This post is an edit of my original which was published on Medium in October, 2023)