Why Add ElastiFlow Data to Elastic?
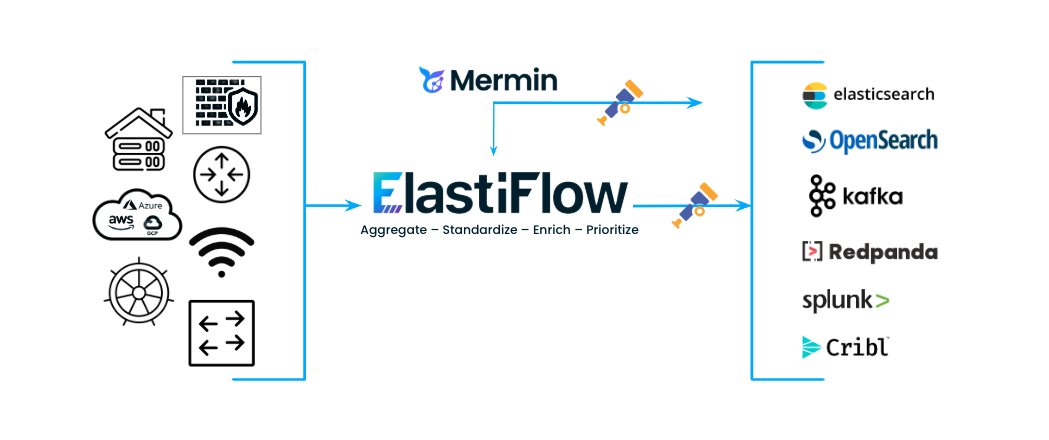
As many of our customers know, the combination of ElastiFlow and Elastic is powerful. Our partnership enables teams to harness the full potential of the network by combining ElastiFlow’s network traffic analysis and performance monitoring with the Elastic Stack. This integrated solution empowers teams to transform raw flow data into actionable, real-time intelligence.
Benefits of Adding ElastiFlow Data to Elastic
Gain complete network visibility: Collect, enrich, and standardize network traffic records across your entire infrastructure. Extend access to a single source of truth (enriched network traffic records) across functions, dismantling silos between XOps teams.
Accelerate time to value: Leverage over 40 pre-configured dashboards for at-a-glance monitoring of traffic, performance, and security. Our turnkey solution includes 120+ machine learning jobs to automatically detect anomalies, identify patterns, and surface potential threats.
Enterprise-grade performance and scalability: Designed to scale effortlessly as your data volume fluctuates. ElastiFlow provides native support for TSDS and additional storage savings capabilities while accelerating query times by an average of 30%.
Use Cases Unlocked by Adding ElastiFlow Data to Elastic:
Network Traffic Analysis: Understand exactly who is talking to whom, what paths they are taking, and which applications consume the most bandwidth.
Capacity Planning: Analyze historical trends to accurately forecast bandwidth requirements, plan infrastructure upgrades, and avoid service degradation.
Performance Troubleshooting: Quickly pinpoint the source of issues to resolve network, application, and service slowdowns faster.
Security Monitoring: Detect DDoS attacks, data exfiltration, network scanning, and other malicious activities by leveraging enriched data and machine learning.
What is AutoOps?
AutoOps is a cloud-based monitoring and alerting tool specifically tailored to Elasticsearch. In addition to basic metrics monitoring, it provides alerting for prebuilt events that guide users through the event cause, impact, and potential resolution steps. This detailed event information will accelerate resolution times and can help users proactively address issues before they cause downstream impact.
Users of all skill levels with Elasticsearch will find benefits from AutoOps, but it will be particularly impactful for teams with limited familiarity with Elasticsearch and don't necessarily know what to monitor or how to interpret the data they have.
Key Capabilities of AutoOps:
Performance Monitoring: Tracks indexing and search rates at the node, index, and shard levels - critical for high-volume flow data.
Prebuilt Alert Events: Detailed impact and mitigation information for each event, tailored to your specific situation. Over 100 events to alert on
Proactive Health Checks: Automatically identifies "hot spotting" (uneven resource usage) and provides recommendations to avoid common performance pitfalls.
Zero-Cost Entry: Free for all users, including those on the free basic license for self-hosted clusters.
Real-World Use Cases
How does AutoOps help users of ElastiFlow manage their data in Elasticsearch? Here are a few common scenarios:
1. Identifying Node Hot Spotting
As flows are collected from more network devices and the Elasticsearch cluster size is increased to handle a greater load, users may forget to review their sharding strategy to ensure the load is evenly distributed across all available nodes. If most of the indexing or search load is concentrated in a single or small number of indices and the number of primary shards doesn't match the number of data nodes in the cluster, you will see hot spotting with some nodes bearing significantly more load than others.
AutoOps offers a variety of events that can help identify when hot spotting is occurring, including tier-specific or node-type-specific alerts for nodes that are more loaded than others, and slow indexing and slow search performance alerts across the cluster, as well as within data tiers.
Once an alert highlights the performance issue, you can easily drill into indexing and search rates at the node, index, and shard level to identify the specific indices that are causing high utilization. This can help you quickly see when increasing primary shard counts or replica counts could more evenly spread indexing and search loads across the cluster.
2. Disk Usage Management
A common failure mode in Elasticsearch clusters is disks becoming full without users realizing it until the flood stage watermarks have already been hit, leading to read-only indices and potential data loss.
The watermark events in AutoOps will alert at each of the low, high, and flood stage watermarks. Additionally, they can be customized to alert at a set level before the watermark is even tripped. This lets you build in the time you need to react and ensure that your data is never at risk.
3. Finding and Preventing Circuit Breaker Errors
When the Java heap usage is high in the cluster, and a request comes in that would cause an OutOfMemory error, Elasticsearch tries to instead return a circuit breaker error on that specific task rather than process the task and kill the whole node with the OOM. Users can often see these circuit breaker errors, for example, when running search loads with heavy aggregations, or when indexing very large documents. To properly manage cluster load and sizing, administrators must be able to see when these errors arise.
AutoOps has events covering both circuit breaker counts and memory usage approaching circuit breaker limits, providing both reactive alerting to active issues and proactive alerting before any errors even occur. This will give you specific information on which resource is at issue (parent, field data, or request circuit breaker) and steps to take to reduce this heap usage.
How to Set Up AutoOps
Requirements to Set Up AutoOps
Elasticsearch 7.17.X+
A host for the AutoOps agent, which can reach both Elasticsearch and the internet (we recommend your ElastiFlow collector host)
During Setup, You'll Need to Provide:
Elasticsearch URL
Basic auth credentials or an API key
Path to CA certs if using custom TLS certs
Setting Up AutoOps
We have created a docs page that details how to setup AutoOps for self-managed Elasticsearch clusters. You will also find extra troubleshooting tips in case you run into any errors. You can also watch me walk through the install process in this video.
Resources:
Get a free trial of ElastiFlow to see enhanced visibility in your Elastic dashboards.
Read the in-depth guide to setting up AutoOps for self-managed Elasticsearch clusters in our Docs.
Stay connected
Sign up to stay connected and receive the latest content and updates from us!