Before There Was OTel, There Were Trad Signals
TL;DR: Before OpenTelemetry (OTel) existed, SNMP, NetFlow, and packet analyzers were producing critical network signals. Most organizations still run them today, but unfortunately, leave the data siloed. This post walks through how to take a traditional signal, an AWS VPC Flow Log sitting in S3, and export it as a flow trace using three OTel components: an S3 Receiver, a Custom Processor, and a ClickHouse Exporter. Then you'll see what you’re still missing.
The Signal That Saved the Deploy
In April 2011, AWS took a routine network configuration action in US-East-1 and accidentally triggered one of the most famous storage failures in cloud history. A set of EBS nodes lost contact with their mirrors, the system began aggressive re-mirroring, and the replication traffic cascaded into a storm that saturated the network and trapped volumes in a stuck state.
From the application side, it looked like pure chaos. Instances were healthy, code hadn't changed, but I/O latency shot through the roof, and volumes stopped behaving like disks. Teams saw symptoms in their applications, but the cause lived lower in the stack. A network event triggered a storage control-plane failure that app-level telemetry could only describe, not explain.
That gap is the point. The network and storage substrate were emitting the critical signals first, but the people debugging at the application layer were still left reconstructing the blast radius from the outside.
That was over a decade ago. So where have those signals gone?
They haven't disappeared. They've been walled off.
NetOps teams still run NetFlow collectors, SNMP pollers, and monitor interface utilization with a variety of tools. While Packets-per-second TCP retransmissions and BGP route flaps are still a critical concern, that data lives in its own silo, invisible to the platform engineering teams building critical OTel-instrumented microservices.
The network is the only truly shared substrate. Every trace, every metric, every log traverses it. But the people who observe the network and the people who observe the applications operate in parallel universes. NetOps has their dashboards. DevOps has theirs. Imagine what would happen if we could break down the silos. What if we could speak the same language? We need to start speaking the same language for network signals – Open Telemetry
We're not replacing the tools that NetOps already trusts, but exporting what those tools produce into a format that the rest of the observability stack can consume, correlate, and act on.
That's what I'm going to build in this post. A small OTel Collector that reads AWS VPC Flow Logs from S3, transforms them into flow traces, and ships them to ClickHouse. Three components, around 200 lines of Go, and I'll show you what you're still missing.
The Architecture
The pipeline is straightforward. We have three OTel Collector components, two off-the-shelf and one we build ourselves:
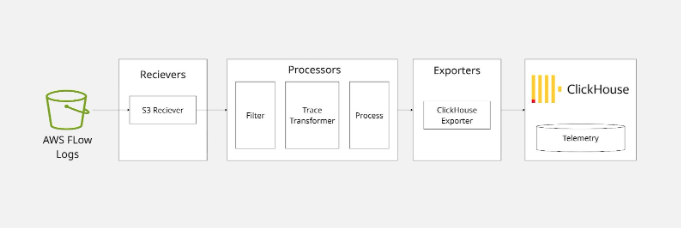
The AWS S3 receiver reads objects from an S3 bucket -- either by time range or by subscribing to an SQS queue. It emits each line of text as an OTLP log record. Our custom processor picks up those log records, parses the space-delimited VPC flow log format, and emits OTLP trace spans. The ClickHouse exporter takes those spans and writes them to a table. That's it.
Let's walk through each piece.
The Incoming Data
AWS VPC Flow Logs are deceptively simple. They arrive in S3 as gzipped text files. Each file has a header row defining the field names, followed by one row per flow record, space-delimited: version account-id interface-id `srcaddr` dstaddr srcport dstport protocol packets bytes start end action log-status
12 197329662517 eni-04b4a7b97f0ef72d3 162.159.200.1 10.0.0.202 123 50607 17 1 76 1638395666 1638395726 ACCEPT OK
That's a version 2 log. Fourteen fields. Source IP, destination IP, ports, protocol number, packet and byte counts, start and end timestamps as epoch seconds, the firewall action, and a log status. A dash (-) means "no data for this field."
Versions 3 through 6 get progressively richer. By version 5, you're looking at 29 fields: VPC ID, subnet, instance, region, availability zone, TCP flags, NAT addresses (the real source/destination before VPC translation), flow direction, and the AWS service on each end of the connection. Version 6 adds transit gateway topology (source and destination VPCs, subnets, ENIs, and availability zones across the gateway) plus packet loss counters. There are also ECS-specific fields for container workloads.
In total, AWS defines 52 possible fields across all versions. The header line tells you which ones are present in any given file.
For our collector, we only need to care about the fields that appear in the data. The header row is our schema.
Setting Up the S3 Receiver
The awss3receiver from the OpenTelemetry Collector contrib repository handles the S3 interaction for us. We configure it with a bucket, prefix, region, and either a time range or an SQS queue URL. Since VPC Flow Logs are plain text (gzipped), we use a text_encoding extension to split each file into individual lines:
1 2 3 4 5 6 7 8 9 10 11 12 13 14 15extensions: text_encoding: encoding: utf8 unmarshaling_separator: "\n" receivers: awss3: starttime: "2026-01-01" endtime: "2026-01-02" s3downloader: region: us-east-1 s3_bucket: my-vpc-flow-logs s3_prefix: AWSLogs/123456789012/vpcflowlogs/us-east-1 encodings: - extension: text_encoding suffix: ".log.gz"
Each line of the flow log file arrives as a separate OTLP log record. The first line is the header (field names), and every subsequent line is a flow record. Our processor will need to handle both.
For production, you'd replace the time range with an SQS queue that receives S3 event notifications, so the collector processes new files as they land. But for a blog post, time range is simpler to reason about.
Building the Custom Processor
This is the meat of the project. We need a connector -- a component that receives OTLP logs and emits OTLP traces. In OTel Collector terms, this is a connector that bridges the logs pipeline to the traces pipeline.
The job is simple in concept:
Receive a log record (one line of text).
If it's a header line, stash the field names.
If it's a data line, split by spaces, zip with the field names, and build a trace span.
Let's look at the code.
Factory and Config
Every OTel Collector component starts with a factory. Ours registers a connector that consumes logs and produces traces:
1 2 3 4 5 6 7 8 9 10 11 12 13 14 15 16 17 18 19 20 21 22 23 24 25 26 27 28 29 30// factory.go package flowlogconnector import ( "context" "go.opentelemetry.io/collector/component" "go.opentelemetry.io/collector/connector" "go.opentelemetry.io/collector/consumer" ) const typeStr = "flowlog" func NewFactory() connector.Factory { return connector.NewFactory( component.MustNewType(typeStr), createDefaultConfig, connector.WithLogsToTraces(createLogsToTraces, component.StabilityLevelAlpha), ) } func createDefaultConfig() component.Config { return &Config{} } func createLogsToTraces( ctx context.Context, set connector.Settings, cfg component.Config, nextConsumer consumer.Traces, ) (connector.Logs, error) { return newConnector(set.Logger, cfg.(*Config), nextConsumer) }
The config is intentionally bare. We could add options for field mapping overrides later, but for now, the defaults are enough:
1 2 3 4// config.go package flowlogconnector type Config struct{}
The Connector
Here's where the actual work happens. The full implementation lives in connector.go, but it's easier to understand if you read it as three small ideas instead of one big file.
First, the connector caches the header row and rejects any record it can't safely interpret:
1 2 3 4 5 6 7 8 9 10 11 12 13 14 15 16 17 18 19 20 21 22 23 24 25 26 27 28func (c *flowlogConnector) ConsumeLogs(ctx context.Context, ld plog.Logs) error { traces := ptrace.NewTraces() body := lr.Body().Str() for _, line := range strings.Split(body, "\n") { parts := strings.Fields(strings.TrimSpace(line)) if len(parts) == 0 { continue } if parts[0] == "version" { c.fields = parts continue } if c.fields == nil || len(parts) != len(c.fields) { c.logger.Warn("skipping line: field count mismatch or no header") continue } c.buildSpan(traces, parts) } if traces.SpanCount() == 0 { return nil } return c.nextConsumer.ConsumeTraces(ctx, traces) }
That small state machine is the whole parser. AWS Flow Logs start with a schema line, and every subsequent record is just a space-delimited row that has to match that schema exactly.
Next, we turn one parsed record into one span:
1 2 3 4 5 6 7 8 9 10 11 12 13 14 15 16 17func (c *flowlogConnector) buildSpan(traces ptrace.Traces, values []string) { record := make(map[string]string, len(c.fields)) for i, name := range c.fields { if values[i] != "-" { record[name] = values[i] } } rs := traces.ResourceSpans().AppendEmpty() ss := rs.ScopeSpans().AppendEmpty() span := ss.Spans().AppendEmpty() span.SetTraceID(generateTraceID(record)) span.SetSpanID(generateSpanID(record)) span.SetName(spanName(record)) span.SetKind(ptrace.SpanKindClient) }
The important design choice here is conceptual, not mechanical. We're treating a network flow as a span-shaped event. That gives us timestamps, a name, a stable ID, and a place to hang attributes without inventing a brand new storage model.
Finally, we map the raw AWS fields into something OTel-native:
1 2 3 4 5 6 7 8 9 10 11 12 13 14 15 16attrs := span.Attributes() for field, value := range record { fm, ok := fieldMapping[field] if !ok { attrs.PutStr("aws.vpc.flowlog."+field, value) continue } switch fm.typ { case fieldTypeInt: if v, err := strconv.ParseInt(value, 10, 64); err == nil { attrs.PutInt(fm.key, v) } case fieldTypeString: attrs.PutStr(fm.key, value) } }
Known fields are normalized into semantic-ish keys, such as source.address and destination.port. Unknown fields are still preserved under an aws.vpc.flowlog.* prefix, which is a nice property for a first pass: we don't lose data just because we haven't modeled it yet.
One other subtle decision is worth calling out. Trace IDs are derived from the 5-tuple, so repeated observations of the same conversation stay grouped:
1 2 3 4 5 6 7 8 9 10 11 12func generateTraceID(record map[string]string) pcommon.TraceID { h := sha256.New() h.Write([]byte(record["srcaddr"])) h.Write([]byte(record["dstaddr"])) h.Write([]byte(record["srcport"])) h.Write([]byte(record["dstport"])) h.Write([]byte(record["protocol"])) sum := h.Sum(nil) var tid pcommon.TraceID copy(tid[:], sum[:16]) return tid }
That's not "distributed tracing" in the app sense, but it is enough to make related flows correlate cleanly inside an OTel backend.
The Field Map
This is the part where we start to map fields according to our predefined schema. The full mapping lives in fieldmap.go, but the pattern is more important than the inventory:
1 2 3 4 5 6 7 8 9 10var fieldMapping = map[string]fieldDef{ "srcaddr": {key: "source.address", typ: fieldTypeString}, "dstaddr": {key: "destination.address", typ: fieldTypeString}, "srcport": {key: "source.port", typ: fieldTypeInt}, "dstport": {key: "destination.port", typ: fieldTypeInt}, "protocol": {key: "network.transport", typ: fieldTypeString}, "packets": {key: "flow.packets.delta", typ: fieldTypeInt}, "bytes": {key: "flow.bytes.delta", typ: fieldTypeInt}, "action": {key: "flow.forwarding.status.name", typ: fieldTypeString}, }
Each entry answers two questions: what should this field be called in the output, and should it be stored as a string or an integer? Once you see that pattern, the rest of the file is just additional coverage for AWS-specific metadata, such as VPC IDs, subnet IDs, transit gateway fields, and packet-loss counters.
There are also helpers for protocol numbers:
1 2 3 4 5var ianaProtoName = map[string]string{ "1": "icmp", "6": "tcp", "17": "udp", }
Notice what's not here: we don't resolve protocol numbers to names in the attributes (we just store the raw value or use it for the span name). We don't decode TCP flag bitmasks into human-readable tags. We don't look up IANA port names. We don't resolve ASNs or geolocations. We don't determine client vs. server. Well…We'll come back to that last part.
ClickHouse Exporter
Once our data is an OTLP trace, the ClickHouse exporter is plug-and-play. We don't need to think about table schemas -- the exporter handles that for us:
1 2 3 4 5 6 7 8 9 10 11exporters: clickhouse: endpoint: tcp://clickhouse:9000 database: netobserv traces_table_name: flow_traces ttl: 72h retry_on_failure: enabled: true initial_interval: 5s max_interval: 30s max_elapsed_time: 300s
That's it. The exporter creates the table if it doesn't exist, maps span attributes to columns, and handles batching and retries. This is the beauty of speaking OTLP: once your data is in the format, the entire ecosystem of exporters opens up. ClickHouse today, Jaeger tomorrow, Elasticsearch next week. Same data, different backends.
Putting It All Together
The Builder Config
We compile our custom collector using OCB (the OpenTelemetry Collector Builder). The builder config declares which components to include:
1 2 3 4 5 6 7 8 9 10 11 12 13 14 15 16 17 18 19 20# builder-config.yaml dist: name: flowlog-collector description: Minimal collector for AWS VPC Flow Logs output_path: ./build otelcol_version: "0.120.0" extensions: - gomod: go.opentelemetry.io/collector/extension/zpagesextension v0.120.0 - gomod: github.com/open-telemetry/opentelemetry-collector-contrib/extension/encoding/textencodingextension v0.120.0 receivers: - gomod: github.com/open-telemetry/opentelemetry-collector-contrib/receiver/awss3receiver v0.120.0 connectors: - gomod: github.com/elastiflow/learning/flowlogconnector v0.0.1 exporters: - gomod: github.com/open-telemetry/opentelemetry-collector-contrib/exporter/clickhouseexporter v0.120.0 - gomod: go.opentelemetry.io/collector/exporter/debugexporter v0.120.0
The Full Collector Config
1 2 3 4 5 6 7 8 9 10 11 12 13 14 15 16 17 18 19 20 21 22 23 24 25 26 27 28 29 30 31 32 33 34 35 36 37 38 39 40 41 42 43 44 45# otel-collector-config.yaml extensions: text_encoding: encoding: utf8 unmarshaling_separator: "\n" receivers: awss3: starttime: "2026-01-01" endtime: "2026-01-02" s3downloader: region: us-east-1 s3_bucket: my-vpc-flow-logs s3_prefix: AWSLogs/123456789012/vpcflowlogs/us-east-1 endpoint: http://minio:9000 s3_force_path_style: true encodings: - extension: text_encoding suffix: ".log.gz" connectors: flowlog: exporters: clickhouse: endpoint: tcp://clickhouse:9000 database: netobserv traces_table_name: flow_traces ttl: 72h retry_on_failure: enabled: true debug: verbosity: detailed service: extensions: [text_encoding] pipelines: logs/s3: receivers: [awss3] exporters: [flowlog] traces/clickhouse: receivers: [flowlog] exporters: [clickhouse, debug]
The two-pipeline setup is the key insight. The logs/s3 pipeline reads from S3 and pushes into the flowlog connector. The traces/clickhouse pipeline reads from the connector and writes to ClickHouse. The connector bridges logs to traces -- it's the translation layer.
Helm Deployment
Today, we package the whole demo as a Helm chart in [`helm/`](../helm). Instead of wiring up local containers by hand, the chart deploys the collector, ClickHouse, and an optional MinIO plus seed job for sample data.
The defaults in [`helm/values.yaml`](../helm/values.yaml) capture the same knobs we used in the standalone config:
1 2 3 4 5 6 7 8 9 10 11 12 13 14 15 16collector: starttime: "2026-01-01" endtime: "2026-01-02" s3: region: us-east-1 bucket: my-vpc-flow-logs prefix: AWSLogs/123456789012/vpcflowlogs/us-east-1 endpoint: "" forcePathStyle: false minio: enabled: true seed: enabled: true
The nice part is that the collector config is still the same two-pipeline design. Helm just templates it into a Kubernetes `ConfigMap` and mounts it into the collector `Deployment`.
To install the stack:
1helm install trad-signals ./helm
If you're targeting real AWS S3 instead of the bundled MinIO, disable MinIO and point the chart at your bucket settings in `values.yaml`. If you're just kicking the tires locally, leave `minio.enabled` and `seed.enabled` on, and the chart will stand up a self-contained demo environment.
Once the release is up, you can validate that traces landed in ClickHouse with the query from the chart's `NOTES.txt`. In other words, the operational story is now Kubernetes-native even though the collector logic hasn't changed
The Real Problem Space
So we built a flow log pipeline in a single afternoon. It works. The data lands in ClickHouse. You can query it.
Getting flow logs into an OTel backend is the first step. Making them useful to operators is the harder part. As soon as you move beyond a demo, you run into a predictable set of requirements:
Directionality and Correlation
A raw flow log tells you 10.0.0.5 sent bytes to 192.168.1.10. It doesn’t tell you who started the conversation. Without stateful tracking, your dashboard can’t distinguish between an outbound API call and an inbound SQL injection attempt. Humans infer this from port numbers; automated alerts need more than a guess.
Human-Readable Protocol Semantics
Protocol numbers, ports, and TCP flag bitmasks are compact, but they are not particularly operator-friendly. 6, 80, and 19 are valid raw values. They are not the fastest path to understanding what is happening during an incident.
Context Enrichment
An IP address is just a string of digits. During an incident, you don’t want to be cross-referencing spreadsheets. You need that IP enriched at ingestion with:
Cloud Metadata: What’s the Instance ID? Which K8s Service does this belong to?
Identity: Which AWS IAM role or Security Group is associated with this ENI?
Intelligence: Is this a known Tor exit node or a malicious scanner?
Geography/ASN: Is this traffic staying in-region or crossing international borders?
Schema Normalization Across Inputs
AWS VPC Flow Logs are only one signal source. Real environments usually mix cloud flow logs with NetFlow, IPFIX, sFlow, and other telemetry formats. If each source lands in a different schema, you've recreated the same silo problem one layer higher.
How You Could Solve It
If your goal is production-grade network observability, the harder problem is not moving bytes between systems. It's maintaining enrichment logic, correlation rules, schema consistency, and support for multiple flow sources over time.
That's where a purpose-built collector starts to make sense. Instead of building each piece yourself, you adopt a collector that already understands flow protocols, normalizes the output, and can emit OTLP traces into the rest of your observability stack.
That is the transition point this post highlights. OpenTelemetry gives you the common language. The real design question is how much of the translation layer you want to own.
Where To Explore Next
We started with a simple question: can you turn traditional network signals into OTel traces? Yes.
But the more useful question is this: what has to happen between "raw flow record" and "something an operator can actually use during an incident"?
If you want to explore the production side of that problem space, these are the next places to look:
The ElastiFlow documentation for the broader collector and platform model.
NetObserv OTLP trace output for how flow records are emitted as traces.
NetObserv input configuration for the range of network telemetry sources it can ingest.
K8s Native Flow Collection with Mermin
The Flow Semantic Convention for the data model behind flow-oriented telemetry.
Traditional network signals didn't disappear. They're still running, still valuable, still catching problems before the application layer can explain them. OpenTelemetry can be the bridge. Whether you build that bridge yourself or adopt one that's already paved depends on what problem you're actually trying to solve.
Stay connected
Sign up to stay connected and receive the latest content and updates from us!