Introduction
In the realm of cybersecurity, staying one step ahead of potential threats is crucial for safeguarding digital assets. One of the best ways to stay ahead is by having the right tools in place to monitor and analyze your network traffic and have this data integrated with network security tools such as ElastiFlow with Suricata logs.
The integration of network flow data using ElastiFlow with Suricata logs provides security professionals with a comprehensive and insightful perspective on network activities. A great backend for both outputs is Elasticsearch with Kibana. Elasticsearch provides filebeat which includes a Suricata plugin and Suricata dashboards for easy log integration. filebeat even outputs the Suricata logs in ECS format so you can easily correlate flow data with ElastiFlow (which can also export data in ECS format). This means that common field names will be the same between the two data exports.
ECS allows you to create combined dashboards, drilldowns, and filters that can be used between the two data feeds. ElastiFlow also includes a threat feed integration, which helps you further identify bad actors from external sources. This combination enhances threat detection, incident response, and overall network visibility. Let's delve into the benefits of leveraging network flow data alongside Suricata logs and explore how this dynamic duo can fortify your cybersecurity defenses.
Update June 2024: Since publishing this post, ElastiFlow has launched NetIntel, a product that enhances and enriches flow data with significantly more threat intelligence information.
______________________________________________________________________________
What are Suricata Logs?
Suricata is an open-source network intrusion detection and prevention system (IDS/IPS) that provides real-time monitoring and analysis of network traffic. It is designed to detect and respond to various types of network-based threats and attacks. It can produce IDS alerts and logs of protocol transactions and full packet capture.
______________________________________________________________________________
Benefits of Network Flow Data with Suricata Logs:
Common Schema using Elasticsearch - Both data feeds export data in ECS format. This makes it very easy to create combined dashboards, set common filters and create awesome drilldowns. The use of a common schema enables seamless pivoting between the datasets within these dashboards, facilitating a more efficient and thorough investigation of potential threats.
Enhanced Threat Detection - Network flow data complements Suricata logs by offering a holistic view of network traffic patterns. Combining Suricata's deep packet inspection capabilities with flow data allows security teams to identify anomalous behavior and potential threats more accurately. By correlating events across both datasets, organizations can quickly discern between normal network activities and potential security incidents. ElastiFlow also includes IP reputation data to help on this front.
Improved Incident Response - When a security incident occurs, time is of the essence. Network flow data, which captures the communication patterns between devices, aids in reconstructing the sequence of events leading up to and following an incident. This detailed timeline facilitates a more efficient and effective incident response, helping security teams to isolate compromised systems, understand the scope of the breach, and take corrective actions swiftly.
Comprehensive Network Visibility - Network flow data provides a macroscopic view of the entire network infrastructure. When integrated with Suricata logs, this combination enables security professionals to gain comprehensive visibility into network traffic, including the identification of shadow IT, unauthorized applications, and potential security policy violations. The synergy of these two data sources ensures a more complete understanding of network dynamics.
Optimized Resource Allocation - By combining Suricata logs with network flow data, organizations can better prioritize resources based on real-time threat intelligence. This optimization helps security teams focus on the most critical areas, reducing false positives and minimizing the risk of oversight. The result is a more efficient use of resources and a heightened ability to respond to genuine threats promptly.
See the entire network - By installing Suricata on your primary north/south link and collecting flow from all devices in your network with ElastiFlow you are seeing both north/south and east/west traffic giving you complete network visibility.
Setup Instructions
To harness the power of network flow data in conjunction with Suricata logs, follow these steps for Debian/Ubuntu based deployments. Note: This is a guide for users who are familiar with router and switch flow data, Linux cli, Elasticsearch, and Kibana.
System requirements for a basic setup: Everything will be running on a single host. This setup will be different for a production deployment.
Ubuntu 22.04
8 CPUs
32 GB RAM
500GB HD
Install Suricata
Suricata works by analyzing packet data on your network and exporting metadata, including threat analysis as log data in JSON format. For a production deployment, this would most likely be installed on a VM or bare metal off of a SPAN port, packet broker, tap or in VM environments on a mirror port on your virtual switch. For this article we will be installing Suricata on the same system as ElastiFlow, Elasticsearch, and Kibana (just to demonstrate).
To install Suricata on a Debian-based system you can use the following command.
sudo apt-get update
sudo apt-get install suricata
After the installation is done you need to make some changes to the Suricata configuration file. (/etc/suricata/suricata.yml)
Add your private IP subnet to HOME_NET
address-groups:
HOME_NET: "[192.168.0.0/16,10.0.0.0/8,172.16.0.0/12,172.31.0.0/16
Set your log location (this is where logs will be written).
default-log-dir: /var/log/suricata
Set your rule location to the following (this is where Suricata stores all the rules by default).
default-rule-path: /var/lib/suricata/rules/
Set the interface Suricata will listen on
af-packet:
- interface: ens5
There are a lot of other config options but this will be a basic installation.
Update the current rules for Suricata by running the following
sudo suricata-update
Restart Suricata with your recent changes.
sudo systemctl restart suricata
Ensure Suricata is Active.
sudo systemctl status suricata.service
If there are packets entering the interface specified in the config there will be files with a size located in your log directory. The fast.log may be empty if no alerts have been activated.
ubuntu@ip-172-31-78-182:/var/log/suricata$ pwd
/var/log/suricata
ubuntu@ip-172-31-78-182:/var/log/suricata$ ls -ltr
total 36100
-rw-r--r-- 1 root root 26581 Jan 10 21:40 suricata.log
-rw-r--r-- 1 root root 4285 Jan 11 01:29 fast.log
-rw-r--r-- 1 root root 13021720 Jan 11 02:00 stats.log
-rw-r--r-- 1 root root 23893907 Jan 11 02:00 eve.json
Install and configure your Elasticsearch backend and Kibana user interface
Elasticsearch and Kibana are a great choice for network data and security log collection.
Install Elasticsearch and Kibana:
IMPORTANT: Remember to document all passwords and tokens during the Elasticsearch installation.
Configure Flow Data Collection
ElastiFlow is an industry leading flow collection solution that can ingest NetFlow, IPFIX, sFlow and export the data to your favorite backend.. Once the installation and setup is complete you will need to send flow data to your ElastiFlow agent.
1. Change the following lines of your ElastiFlow configuration
sudo nano /etc/systemd/system/flowcoll.service.d/flowcoll.conf
Environment="EF_LICENSE_ACCEPTED=true"
Environment="EF_OUTPUT_ELASTICSEARCH_ENABLE=true"
Environment="EF_OUTPUT_ELASTICSEARCH_ECS_ENABLE=true"
Environment="EF_OUTPUT_ELASTICSEARCH_ADDRESSES=127.0.0.1:9200"
Environment="EF_OUTPUT_ELASTICSEARCH_USERNAME=elastic"
Environment="EF_OUTPUT_ELASTICSEARCH_PASSWORD=your_password"
Environment="EF_OUTPUT_ELASTICSEARCH_TLS_ENABLE=true"
Environment="EF_OUTPUT_ELASTICSEARCH_TLS_SKIP_VERIFICATION=true"
Environment="EF_OUTPUT_ELASTICSEARCH_TLS_CA_CERT_FILEPATH="
Note: Additional configuration options for Flow correlation with DNS, RiskIQ, AS, Geo, SNMP and user-defined metadata can enhance your network flow data helping isolate threats in a timely manner.. This will be covered in a future blog.
2. Restart ElastiFlow
sudo systemctl restart flowcoll.service
3. Install ElastiFlow dashboards for Kibana (Use the 8.x ECS flow dashboards).
4. Start sending flow data from your routers, switches, firewalls or hosts to ElastiFlow..
Install filebeat
(filebeat is your connector to Elasticsearch for log data)
Configure Filebeats
Make the following changes to your Filebeat configuration file /etc/filebeat/filebeat.yml
define the host IP for your Kibana connection.
setup.kibana:
host: "172.31.78.182:5601"
define the host IP for your Elasticsearch connection.
Output.elasticsearch:
# Array of hosts to connect to.
hosts: ["127.0.0.1:9200"]
# Protocol - either `http` (default) or `https`.
protocol: "https"
# Authentication credentials - either API key or username/password.
#api_key: "id:api_key"
username: "elastic"
password: "your_pass"
output.elasticsearch.ssl.certificate_authorities: ["/etc/filebeat/http_ca.crt"]
Enable the Suricata plugin
sudo filebeat modules enable suricata
Configure your Suricata plugin config file similar to the following
/etc/filebeat/modules.d/suricata.yml
# Module: suricata
# Docs: https://www.elastic.co/guide/en/beats/filebeat/main/filebeat-module-suricata.html
- module: suricata
# All logs
eve:
enabled: true
var.paths: ["/var/log/suricata/eve.json"]
# Set custom paths for the log files. If left empty,
# Filebeat will choose the paths depending on your OS.
#var.paths:
Run the filebeat setup (this will create the filebeat indexes, dashboards etc in Elasticsearch)
sudo filebeat setup -e
Start or Restart filebeat
sudo service filebeat start
Integrate Suricata and Flow Data
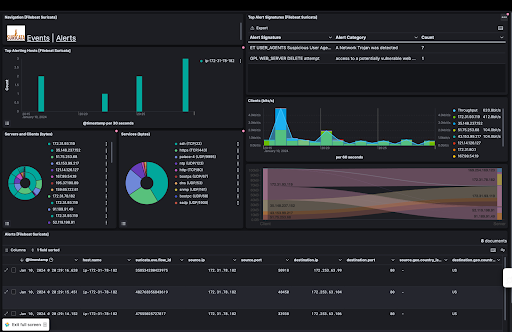
Now that you have two indices (one for network flow data and one for Suricata logs) you can start to build combined dashboards. To start, you can copy panels from ElastiFlow dashboards to Suricata dashboards and visa-versa. Check your ElastiFlow dashboards and Suricata dashboards for data. Here is a combined dashboard with both flow and Suricata logs.
Suricata alerts and ElastiFlow data on the same dashboard:
Conclusion:
Integrating network flow data with Suricata logs is a strategic move for organizations aiming to bolster their cybersecurity observability and posture. This unified approach not only enhances threat detection and incident response but also provides a comprehensive view of network activities. By following the setup instructions outlined above, organizations can harness the combined power of Suricata and network flow data to fortify their defenses against evolving cyber threats. Tune in for future blogs on using this setup to enhance threat detection.
Update June 2024: Since publishing this post, ElastiFlow has launched NetIntel, a product that enhances and enriches flow data with significantly more threat intelligence information.
Stay connected
Sign up to stay connected and receive the latest content and updates from us!